Azure Monitor
An Azure service that is used to collect, analyze, and act on telemetry data from Azure and on-premises environments.
This browser is no longer supported.
Upgrade to Microsoft Edge to take advantage of the latest features, security updates, and technical support.
' cx='32' cy='32' r='32' /%3E%3Ctext x='50%25' y='55%25' dominant-baseline='middle' text-anchor='middle' fill='%23FFF' %3ET%3C/text%3E%3C/svg%3E)
Hello,
I am planning to add a warning threashold to Responsetime chart by using "SLA"
i am using below query, but when i add this chart to dashboard, i am unable to see the SLA line(warning line)
requests
| where operation_Name contains "xxxxxxx" and cloud_RoleName == "xxxxxxxxxxxxxxx"
| summarize avgRequestDuration=avg(duration), percentiles(duration, 95, 99) by bin(timestamp, 1m)
| extend SLA = 1000
| project SLA, avgRequestDuration, percentile_duration_95, percentile_duration_99, timestamp
| render timechart with (ytitle="Duration in MS")
Can someone please help?
' cx='32' cy='32' r='32' /%3E%3Ctext x='50%25' y='55%25' dominant-baseline='middle' text-anchor='middle' fill='%23FFF' %3ESM%3C/text%3E%3C/svg%3E)
Thanks for reaching out!! We are checking the issue and will update you soon
@TTLAzure Thanks for your question !! I have reproduced your issue by adding reference line to identify if the metric exceeded a specific threshold and I am able to view the threshold line. Snapshot for your reference. Kindly check again from your end and revert if you have further questions.
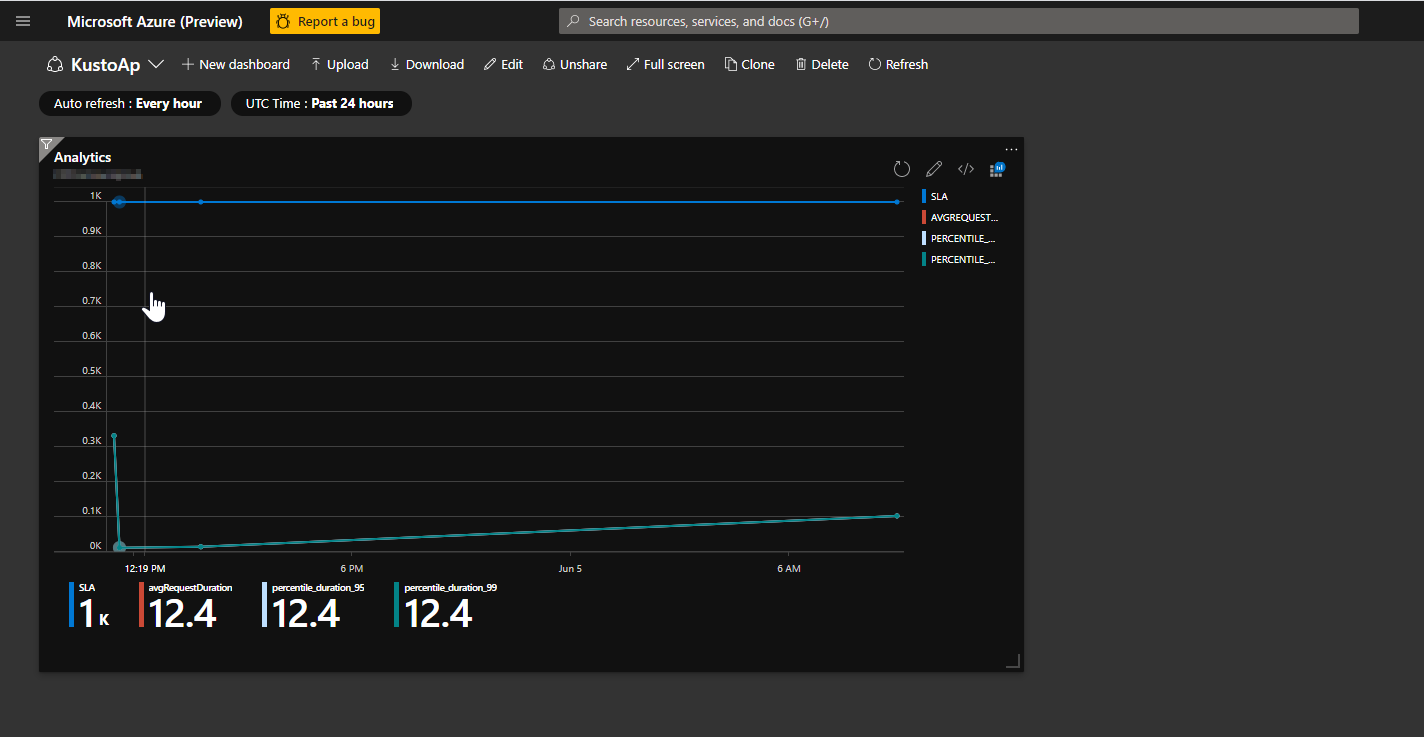
My question is about "Duration in MS" in Ytitle column, If you see 0k, 0.1k,.....0.8k,0.9k,1k , what is this about ? if we didnt specify that these are in Milliseconds no one knows its time in MS.
We know Response time will be in MilliSeconds , But i wanted to display the title there saying its Duration in MS. So it will be easy for everyone to understand who see my chart.
Please check and suggest
@TTLAzure I see you have raised two questions , one is related to warning threshold which I have responded as seen above, the other question is related to the ytitle not being displayed in the image for which I have answered in this question. Just for your reference, currently the functionality is not supported in dashboards.
I would recommend you to navigate here and share your feedback or suggestions directly with the responsible Azure feature team and clicking the vote button of your suggestion to raise visibility and priority on it.