Note
Access to this page requires authorization. You can try signing in or changing directories.
Access to this page requires authorization. You can try changing directories.
Applies to: Multi-rack deployments of Azure Local 2511 and later
This article describes how to monitor your multi-rack deployments of Azure Local with Azure Monitor Metrics. It also describes the Performance Metrics dashboard and lists metrics collected for compute, storage, and network resources in multi-rack deployments of Azure Local.
When you have critical applications and business processes that rely on Azure resources, it's important to monitor those resources for their availability, performance, and operation. The integration of Azure Monitor Metrics with Azure Local enables you to store numeric data from your clusters in a dedicated time-series database. This database is automatically created for each Azure subscription. Use metrics explorer to analyze data from your system and assess its health and utilization.
Important
This feature is currently in PREVIEW. See the Supplemental Terms of Use for Microsoft Azure Previews for legal terms that apply to Azure features that are in beta, preview, or otherwise not yet released into general availability.
Benefits
No extra cost. These metrics are standard, out-of-the-box features that are automatically collected and provided to you at no extra cost.
Near real-time insights. You have the capability to observe out-of-the-box metrics and correlate trends using near real-time data.
Customization. You can create your own graphs and customize them through aggregation and filter functionality. The task of saving and sharing your metric charts via Excel, workbooks, or sending them to Grafana is straightforward.
Custom alert rules. You can write custom alert rules on the metrics to efficiently monitor the health of your system.
Prerequisites
- You must have access to a multi-rack Azure Local system that's deployed, registered, and connected to Azure.
Monitor Azure Local through the Monitoring tab
In the Azure portal, you can monitor platform health and utilization of your cluster by navigating to the Monitoring tab on your cluster's Overview page. This tab offers a quick way to view graphs for different platform metrics. You can select any of the graphs to further analyze the data in metrics explorer.
Follow these steps to monitor metrics of your system in the Azure portal:
Go to your Azure Local cluster resource page and select your multi-rack cluster.
On the Overview page of your cluster, select the Monitoring tab.
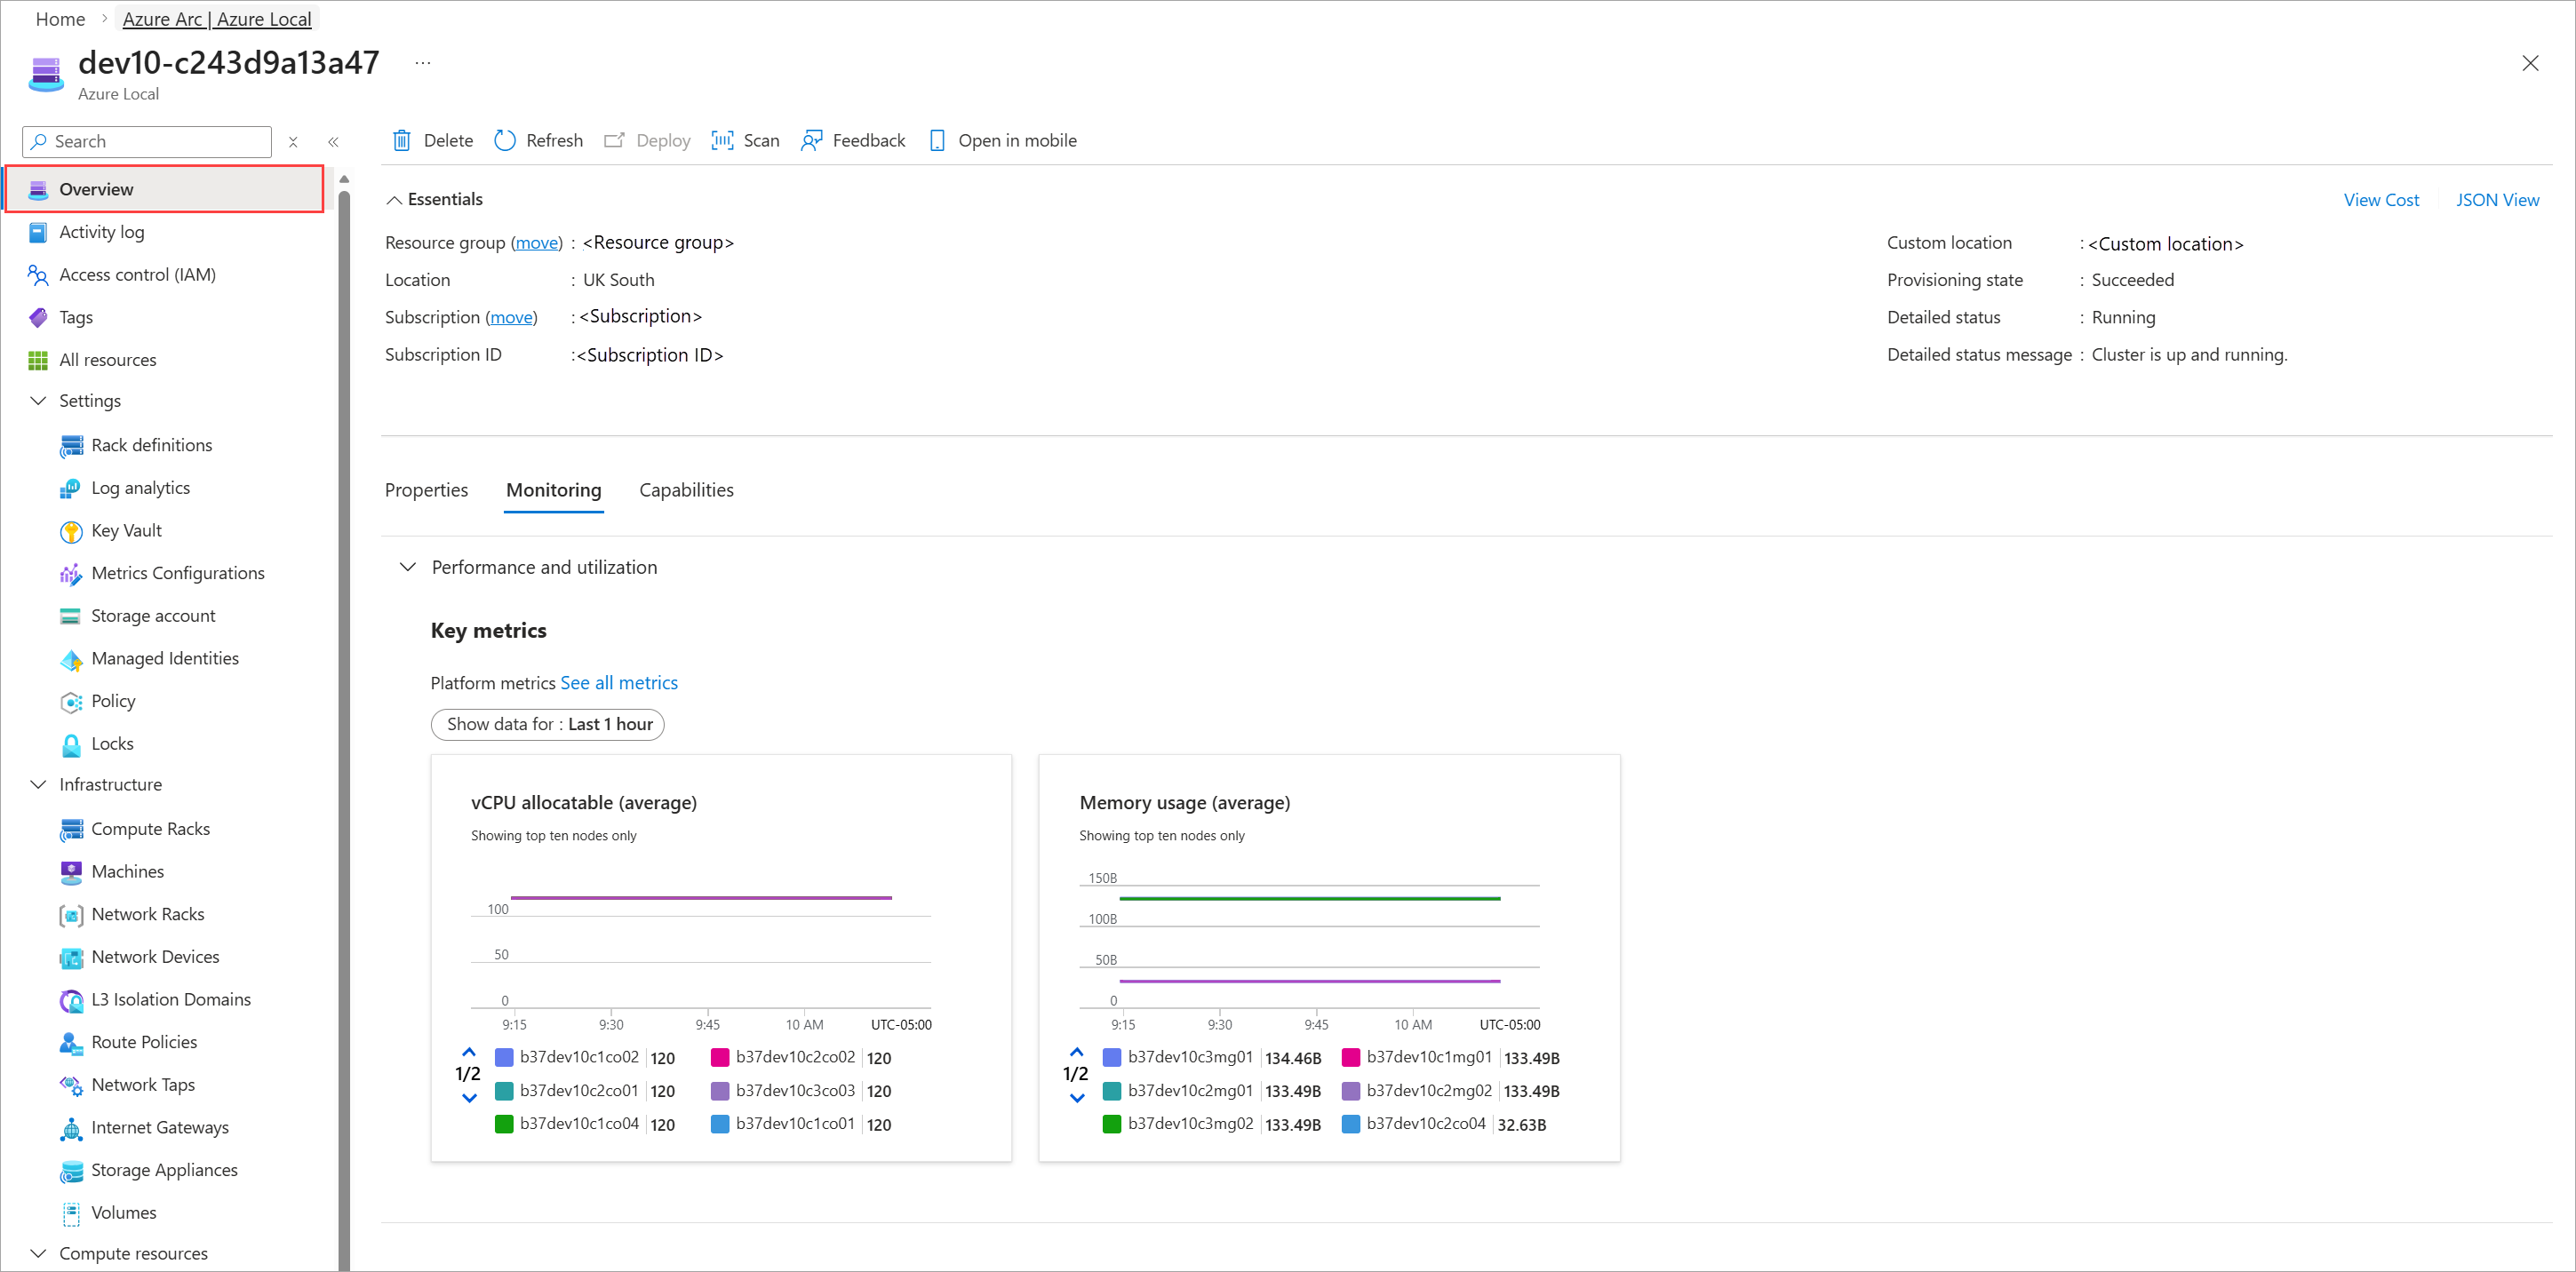
Review the graphs displaying current utilization of the cluster under Performance and Utilization pane.

Analyze metrics
You can use metrics explorer to interactively analyze the data in your metric database and chart the values of multiple metrics over time. To open the metrics explorer in the Azure portal, select Metrics under the Monitoring section.

With Metrics, you can create charts from metric values and visually correlate trends. You can also create a metric alert rule or pin a chart to an Azure dashboard to view them with other visualizations. For a tutorial on using this tool, see Analyze metrics for an Azure resource.
Platform metrics are stored for 93 days, however, you can only query (in the Metrics tile) for a maximum of 30 days' worth of data on any single chart. To know more about data retention, see Metrics in Azure Monitor.
Analyze metrics for a specific cluster
Follow these steps to analyze metrics for a specific cluster in the Azure portal:
Go to your Azure Local multi-rack cluster and navigate to the Monitoring section.
To analyze metrics, select the Metrics option. Your cluster will already be populated in the scope section. Select the metric you want to analyze.
To create alerts, select the Alerts option.