Note
Access to this page requires authorization. You can try signing in or changing directories.
Access to this page requires authorization. You can try changing directories.
Performance counters provide insight into the performance of virtual hardware components, operating systems, and workloads. Collect counters from both Windows and Linux virtual machines using a data collection rule (DCR) with a Performance Counters data source.
Details for the creation of the DCR are provided in Collect data from VM client with Azure Monitor. This article provides additional details for the Performance Counters data source type.
A new data source has been added for OpenTelemetry performance counters, supporting Azure Monitor Workspace as a destination. Read more about the benefits of using this new data source here.
Note
To work with the DCR definition directly or to deploy with other methods such as ARM templates, see Data collection rule (DCR) samples in Azure Monitor.
Configure OpenTelemetry performance counters data source (Preview)
Create the DCR using the process in Collect data from virtual machine client with Azure Monitor. On the Collect and deliver tab of the DCR, select OpenTelemetry Performance Counters from the Data source type dropdown. Select from a predefined set of objects to collect and their sampling rate. The lower the sampling rate, the more frequently the value is collected.
Select Custom for a more granular selection of OpenTelemetry performance counters.
Configure performance counters data source
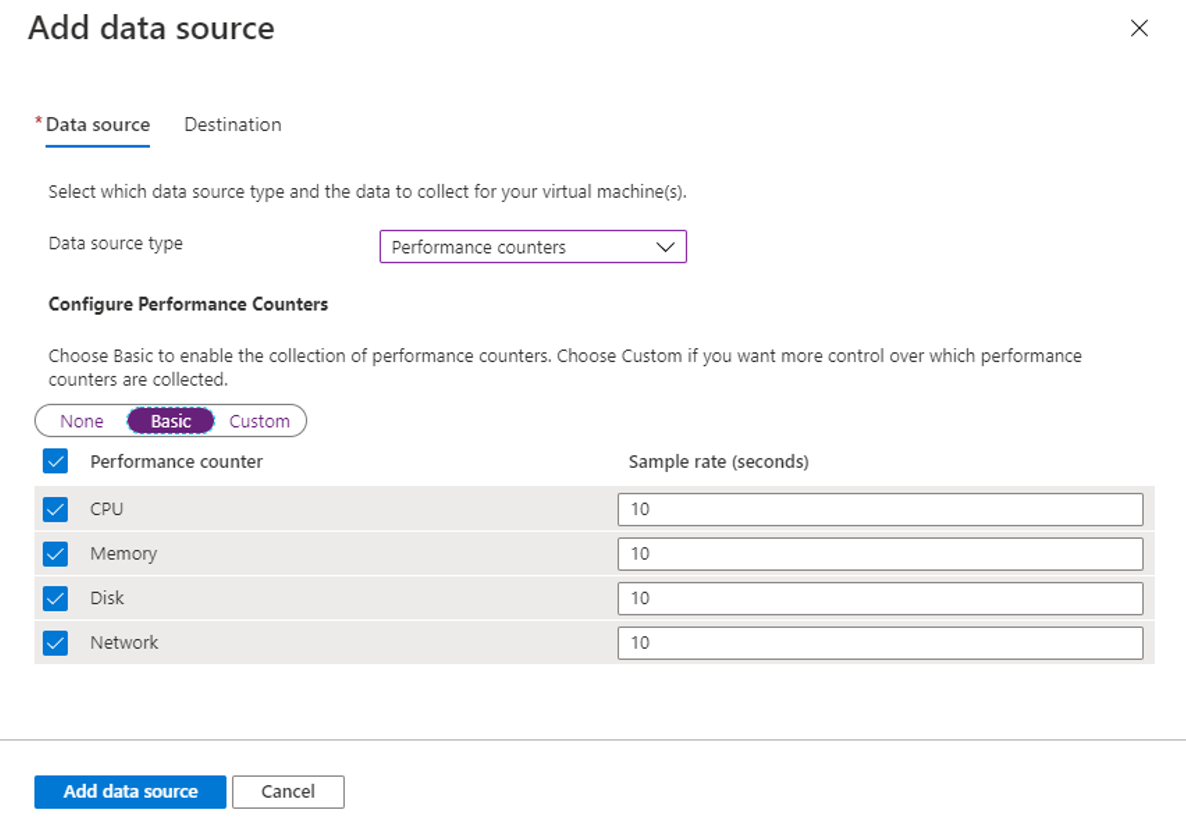
Create the DCR using the process in Collect data from virtual machine client with Azure Monitor. On the Collect and deliver tab of the DCR, select Performance Counters from the Data source type dropdown. Select from a predefined set of objects to collect and their sampling rate. The lower the sampling rate, the more frequently the value is collected.
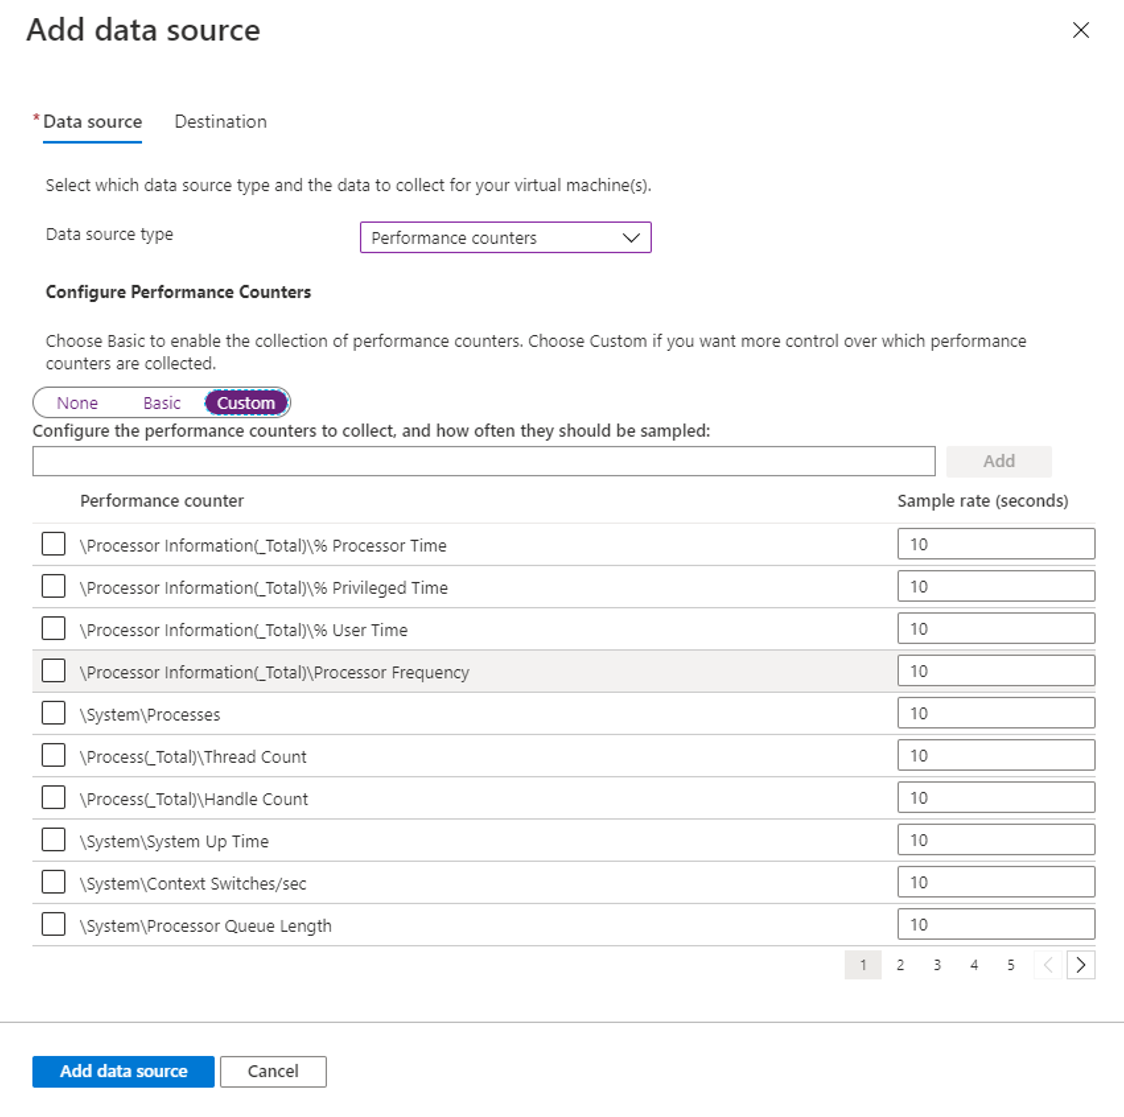
Select Custom to specify an XPath to collect any performance counters not available with the Basic selection. Use the format \PerfObject(ParentInstance/ObjectInstance#InstanceIndex)\Counter.
Tip
If the counter name contains an ampersand (&), replace it with &. For example, \Memory\Free & Zero Page List Bytes.
Warning
Be careful when manually defining counters for DCRs that are associated with both Windows and Linux machines, since some Windows and Linux style counter names can resolve to the same metric and cause duplicate collection. For example, specifying both \LogicalDisk(*)\Disk Transfers/sec (Windows) and Logical Disk(*)\Disk Transfers/sec (Linux) in the same DCR will cause the Disk Transfers metric to be collected twice per sampling period.
This behavior can be avoided by not collecting performance counters in DCRs that don't specify a platform type. Ensure that Windows counters are only included in DCRs associated with Windows machines, and Linux counters are only included in DCRs associated with Linux machines.
Note
Microsoft.HybridCompute (Azure Arc-enabled servers) resources can't currently be viewed in Metrics Explorer, but their metric data can be acquired via the Metrics REST API (Metric Namespaces - List, Metric Definitions - List, and Metrics - List).
Add destinations
OpenTelemetry Performance Counters can be sent to an Azure Monitor Workspace where it can be queried via PromQl. This is the recommended data destination for all users, as Container Insights, Application Insights, and VM Insights are all moving to use Azure Monitor Workspace as their source for metrics instead of Log Analytics workspaces.
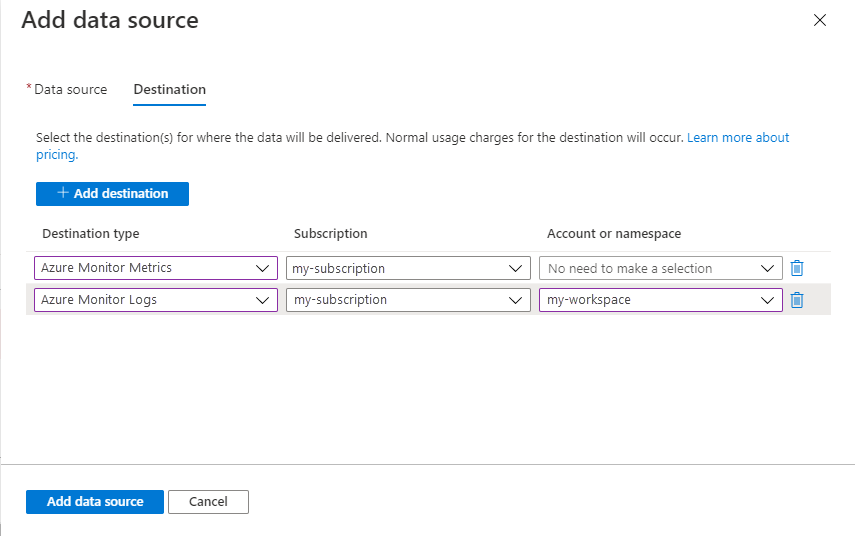
Performance counters can still be sent to a Log Analytics workspace where it's stored in the Perf table and/or Azure Monitor Metrics (preview) where it's available in Metrics explorer. Add a destination of type Azure Monitor Logs and select a Log Analytics workspace. While you can add multiple workspaces, be aware that this will send duplicate data to each which will result in additional cost. No further details are required for Azure Monitor Metrics (preview) since this is stored at the subscription level for the monitored resource.
Verify data collection
To verify OpenTelemetry performance counters are being collected in the Azure Monitor workspace, you can start by scoping a query to the AMW chosen as destination for the DCR, and check for any of the System. metrics flowing as expected.
If the AMW was set to resource-context access mode, you can also verify the same query works as expected when scoped to the VM itself by navigating to the VM Metrics blade in Portal and either choosing the "add with editor" dropdown or choosing the "view AMW metrics in editor" dropdown under Metric Namespaces.
Both entry points should result in a PromQl editor with a query scoped to the VM resource now, where the same query will work as before, but without any need to filter on the VM microsoft.resourceid dimension.
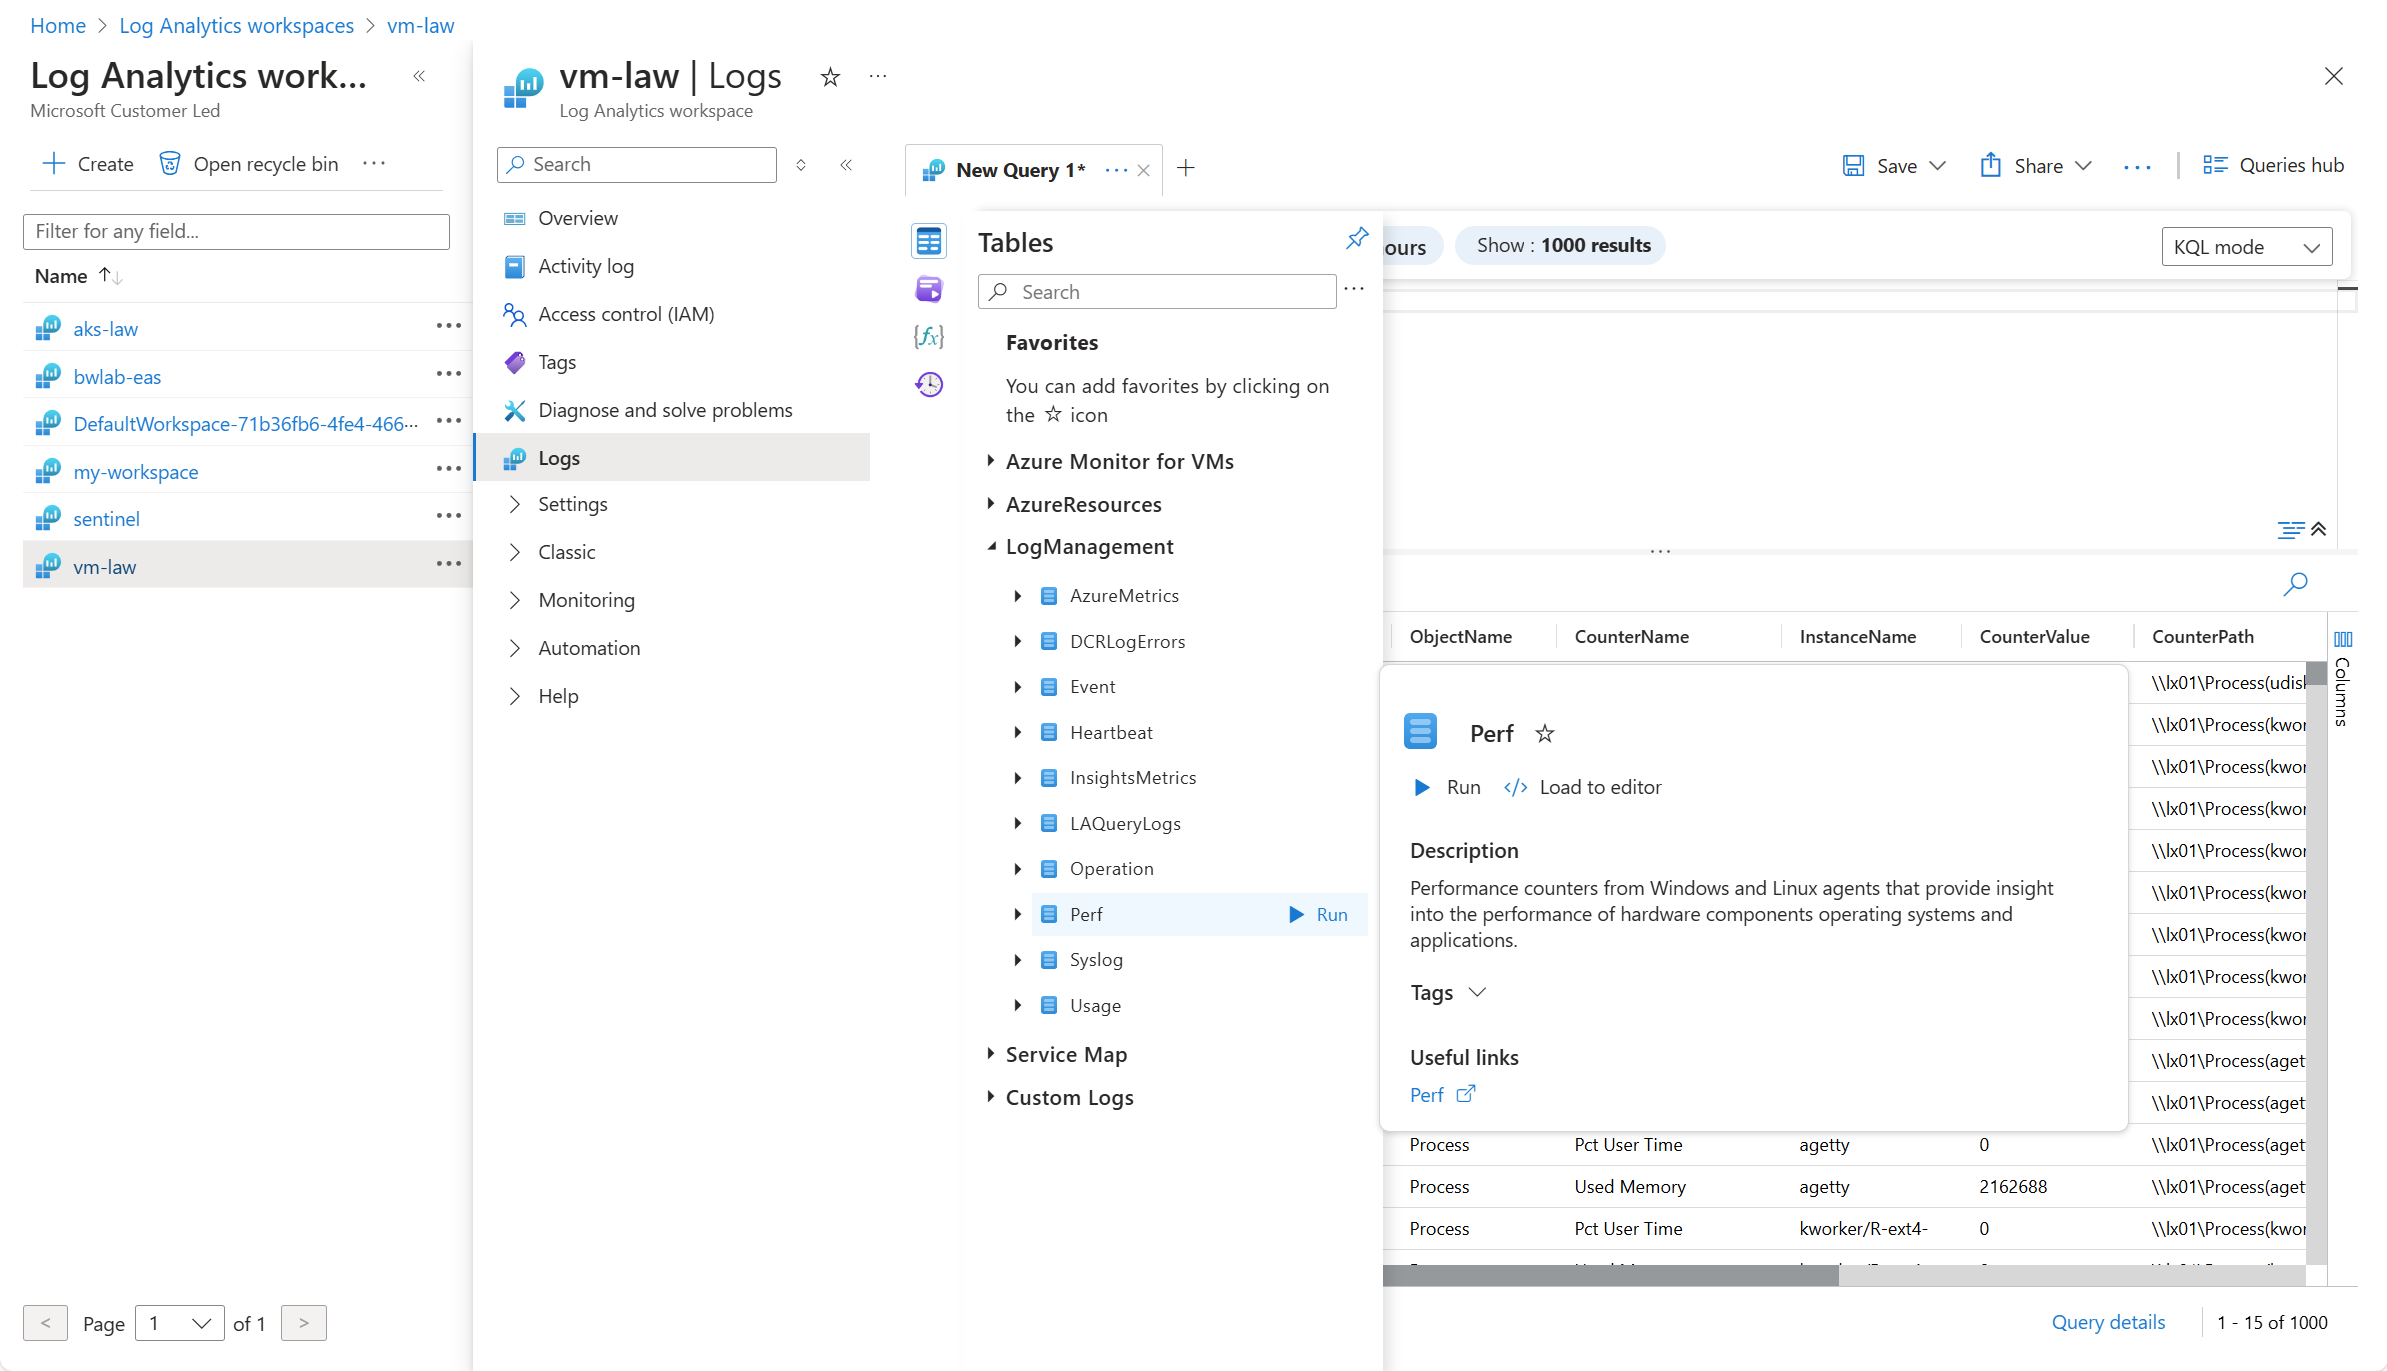
To verify the legacy Performance Counter data source is being collected in the Log Analytics workspace, check for records in the Perf table. From the virtual machine or from the Log Analytics workspace in the Azure portal, select Logs and then click the Tables button. Under the Virtual machines category, click Run next to Perf.
To verify the legacy Performance Counter data source is being collected in Azure Monitor Metrics, select Metrics from the virtual machine in the Azure portal. Select Virtual Machine Guest (Windows) or azure.vm.linux.guestmetrics for the namespace and then select a metric to add to the view.
Performance counters
The following performance counters are available to be collected by the Azure Monitor Agent for Windows and Linux virtual machines. The sample frequency can be changed when creating or updating the data collection rule.
| OTel Performance Counter | Type | Unit | Aggregation | Monotonic | Dimensions | Description |
|---|---|---|---|---|---|---|
| system.cpu.utilization | Gauge | 1 | N/A | FALSE | cpu: Logical CPU number starting at 0 (values: Any Str) state: Breakdown of CPU usage by type (values: idle, interrupt, nice, softirq, steal, system, user, wait) |
Difference in system.cpu.time since the last measurement per logical CPU, divided by the elapsed time (0–1). |
| system.cpu.time | Sum | s | Cumulative | TRUE | cpu: Logical CPU number starting at 0 (values: Any Str) state: Breakdown of CPU usage by type (values: idle, interrupt, nice, softirq, steal, system, user, wait) |
Total seconds each logical CPU spent on each mode. |
| system.cpu.physical.count | Sum | {cpu} | Cumulative | FALSE | (none) | Number of available physical CPUs. |
| system.cpu.logical.count | Sum | {cpu} | Cumulative | FALSE | cpu: Logical CPU number starting at 0 (values: Any Str) | Number of available logical CPUs. |
| system.cpu.load_average.5m | Gauge | {thread} | N/A | FALSE | (none) | Average CPU Load over 5 minutes. |
| system.cpu.load_average.1m | Gauge | {thread} | N/A | FALSE | (none) | Average CPU Load over 1 minute. |
| system.cpu.load_average.15m | Gauge | {thread} | N/A | FALSE | (none) | Average CPU Load over 15 minutes. |
| system.cpu.frequency | Gauge | Hz | N/A | FALSE | (none) | Current frequency of the CPU core in Hz. |
| process.uptime | Gauge | s | N/A | FALSE | (none) | Time the process has been running. |
| process.threads | Sum | {threads} | Cumulative | FALSE | (none) | Process threads count. |
| process.signals_pending | Sum | {signals} | Cumulative | FALSE | (none) | Number of pending signals for the process (Linux only). |
| process.paging.faults | Sum | {faults} | Cumulative | TRUE | type: Type of fault (values: major, minor) | Number of page faults the process has made (Linux only). |
| process.open_file_descriptors | Sum | {count} | Cumulative | FALSE | (none) | Number of file descriptors in use by the process. |
| process.memory.virtual | Sum | By | Cumulative | FALSE | (none) | Virtual memory size. |
| process.memory.utilization | Gauge | 1 | N/A | FALSE | (none) | Percentage of total physical memory used by the process. |
| process.memory.usage | Sum | By | Cumulative | FALSE | (none) | Amount of physical memory in use. |
| system.disk.weighted_io_time | Sum | s | Cumulative | FALSE | device: Name of the disk (values: Any Str) | Time disk spent activated multiplied by queue length. |
| system.disk.pending_operations | Sum | {operations} | Cumulative | FALSE | device: Name of the disk (values: Any Str) | Queue size of pending I/O operations. |
| system.disk.operations | Sum | {operations} | Cumulative | TRUE | device: Name of the disk (values: Any Str) direction: Direction of flow (values: read, write) |
Disk operations count. |
| system.disk.operation_time | Sum | s | Cumulative | TRUE | device: Name of the disk (values: Any Str) direction: Direction of flow (values: read, write) |
Time spent in disk operations. |
| system.disk.merged | Sum | {operations} | Cumulative | TRUE | device: Name of the disk (values: Any Str) direction: Direction of flow (values: read, write) |
Disk reads/writes merged into single physical operations. |
| system.disk.io_time | Sum | s | Cumulative | TRUE | device: Name of the disk (values: Any Str) | Time disk spent activated. |
| system.disk.io | Sum | By | Cumulative | TRUE | device: Name of the disk (values: Any Str) direction: Direction of flow (values: read, write) |
Disk bytes transferred. |
| process.handles | Sum | {count} | Cumulative | FALSE | (none) | Number of open handles (Windows only). |
| process.disk.operations | Sum | {operations} | Cumulative | TRUE | direction: Direction of flow (values: read, write) | Disk operations performed by the process. |
| process.disk.io | Sum | By | Cumulative | TRUE | direction: Direction of flow (values: read, write) | Disk bytes transferred. |
| process.cpu.utilization | Gauge | 1 | N/A | FALSE | state: Breakdown of CPU usage (values: system, user, wait) | Percentage of total CPU time used by the process since last scrape (0–1). |
| process.cpu.time | Sum | s | Cumulative | TRUE | state: Breakdown of CPU usage (values: system, user, wait) | Total CPU seconds broken down by states. |
| process.context_switches | Sum | {count} | Cumulative | TRUE | type: Type of context switch (values: Any Str) | Number of times the process has been context switched (Linux only). |
| system.memory.utilization | Gauge | 1 | N/A | FALSE | state: Breakdown of memory usage (values: buffered, cached, inactive, free, slab_reclaimable, slab_unreclaimable, used) | Percentage of memory bytes in use. |
| system.memory.usage | Sum | By | Cumulative | FALSE | state: Breakdown of memory usage (values: buffered, cached, inactive, free, slab_reclaimable, slab_unreclaimable, used) | Bytes of memory in use. |
| system.memory.page_size | Gauge | By | N/A | FALSE | (none) | System's configured page size. |
| system.memory.limit | Sum | By | Cumulative | FALSE | (none) | Total bytes of memory available. |
| system.linux.memory.dirty | Sum | By | Cumulative | FALSE | (none) | Amount of dirty memory (/proc/meminfo). |
| system.linux.memory.available | Sum | By | Cumulative | FALSE | (none) | Estimate of available memory (Linux only). |
| system.network.packets | Sum | {packets} | Cumulative | TRUE | device: Network interface name (values: Any Str) direction: Direction of flow (values: receive, transmit) |
Number of packets transferred. |
| system.network.io | Sum | By | Cumulative | TRUE | (none) | Bytes transmitted and received. |
| system.network.errors | Sum | {errors} | Cumulative | FALSE | device: Network interface name (values: Any Str) direction: Direction of flow (values: receive, transmit) |
Number of errors encountered. |
| system.network.dropped | Sum | {packets} | Cumulative | TRUE | device: Network interface name (values: Any Str) direction: Direction of flow (values: receive, transmit) |
Number of packets dropped. |
| system.network.conntrack.max | Sum | {entries} | Cumulative | FALSE | (none) | Limit for entries in conntrack table. |
| system.network.conntrack.count | Sum | {entries} | Cumulative | FALSE | (none) | Count of entries in conntrack table. |
| system.network.connections | Sum | {connections} | Cumulative | FALSE | protocol: Network protocol (values: tcp) state: Connection state (values: Any Str) |
Number of connections. |
| system.uptime | Gauge | s | N/A | FALSE | (none) | Time the system has been running. |
| system.processes.created | Sum | {processes} | Cumulative | TRUE | (none) | Total number of created processes. |
| system.processes.count | Sum | {processes} | Cumulative | FALSE | status: Process status (values: blocked, daemon, detached, idle, locked, orphan, paging, running, sleeping, stopped, system, unknown, zombies) | Total number of processes in each state. |
| system.paging.utilization | Gauge | 1 | N/A | FALSE | device: Page file name (values: Any Str) state: Paging usage type (values: cached, free, used) |
Swap (Unix) or pagefile (Windows) utilization. |
| system.paging.usage | Sum | By | Cumulative | FALSE | device: Page file name (values: Any Str) state: Paging usage type (values: cached, free, used) |
Swap (Unix) or pagefile (Windows) usage. |
| system.paging.operations | Sum | {operations} | Cumulative | TRUE | direction: Page flow (values: page_in, page_out) type: Fault type (values: major, minor) |
Paging operations. |
| system.paging.faults | Sum | {faults} | (none) | TRUE | type: Fault type (values: major, minor) | Number of page faults. |
| system.filesystem.utilization | Gauge | 1 | N/A | FALSE | device: Filesystem identifier mode: Mount mode (values: ro, rw) mountpoint: Path type: Filesystem type (values: ext4, tmpfs, etc.) |
Fraction of filesystem bytes used. |
| system.filesystem.usage | Sum | By | Cumulative | FALSE | device: Filesystem identifier mode: Mount mode mountpoint: Path type: Filesystem type state: Usage type (values: free, reserved, used) |
Filesystem bytes used. |
| system.filesystem.inodes.usage | Sum | {inodes} | Cumulative | FALSE | device: Filesystem identifier mode: Mount mode mountpoint: Path type: Filesystem type state: Usage type (values: free, reserved, used) |
Filesystem inodes used. |
Next steps
- Learn more about OpenTelemetry performance counters
- Learn more about Azure Monitor Agent.
- Learn more about data collection rules.


