Note
Access to this page requires authorization. You can try signing in or changing directories.
Access to this page requires authorization. You can try changing directories.
In this article, you learn how to set up, monitor, and troubleshoot with Azure StandardV2 NAT Gateway flow logs. These logs can help you monitor and analyze the traffic flows going through your NAT gateway resource. The health event logs are provided through the Azure Monitor resource log category NatGatwayFlowlogsV1, which is enabled through Diagnostic Settings.
Prerequisites
- An Azure subscription. If you don't have an Azure subscription, create a free account.
- An Azure StandardV2 NAT Gateway resource. To learn how to create a StandardV2 NAT Gateway resource, see Quickstart: Create a StandardV2 NAT Gateway.
- An Azure Monitor Log Analytics workspace. To learn how to create a Log Analytics workspace, see Quickstart: Create a Log Analytics workspace.
Important
StandardV2 Azure NAT Gateway is currently in PREVIEW. See the Supplemental Terms of Use for Microsoft Azure Previews for legal terms that apply to Azure features that are in beta, preview, or otherwise not yet released into general availability.
Enable diagnostic settings to collect NAT gateway flow logs
In this section, you learn how to set up StandardV2 NAT gateway flow logs and send it to the recommended destination – Log Analytics workspace, which enables you to manage data retention and access. To learn more about the other destinations, including Azure Storage account and Azure Event Hubs, see Diagnostic settings in Azure Monitor - Azure Monitor | Microsoft Learn.
Note
If you're sending logs to Azure Storage or Event Hubs, ensure the region of your storage account and Event Hubs namespace are in the same region as your StandardV2 NAT gateway resource.
In the Azure portal, navigate to your StandardV2 NAT gateway resource.
From your NAT gateway resource's Overview page, choose Monitoring > Diagnostic settings.
Select + Add diagnostic setting.
In the Diagnostic setting window, select or enter the following settings:
Setting Value Diagnostic setting name Enter a name for the diagnostic setting. Logs Category Groups Select NatGatewayFlowlogsV1. Metrics Leave unchecked. Destination details Select Send to Log Analytics workspace.
Select your subscription and your Log Analytics workspace.Select Save and close the Diagnostic setting window.
Note
Once your diagnostic setting is configured, it can take up to 90 minutes for logs to appear.
Configure a log query
In this section, you learn how to query StandardV2 NAT Gateway flow logs to identify virtual machines generating the most outbound traffic sent – commonly referred to as top talkers. This insight is useful for diagnosing unexpected spikes in traffic and understanding bandwidth consumption patterns. The sample query provided sorts the virtual machines by the total number of packets sent in descending order. The query allows you to quickly pinpoint which virtual machines are sending the most outbound traffic from your NAT gateway.
In the Azure portal, navigate to your Log Analytics workspace resource associated to your StandardV2 NAT gateway resource.
From your Log Analytics workspace's Overview page, choose Logs.
Enter the following code in the query editor:
The following code is displayed in the query editor:
    NatGatewayFlowlogsV1
    | where TimeGenerated > ago(1d)
    | summarize TotalPacketsSent = sum(PacketsSent) by SourceIP
    | sort by TotalPacketsSent desc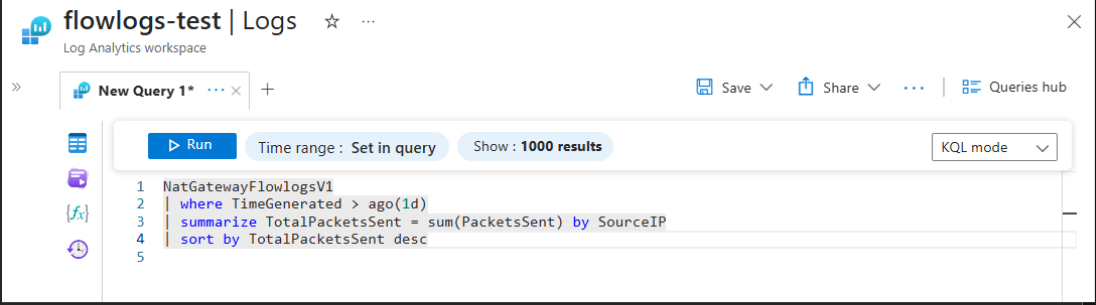
Select Run to execute the query.
If you want to modify and save the query, make your query changes and select Save>Save as query.
In the Save a query window, enter a name for the query, other optional information, and select Save.
Next step
For more information about StandardV2 NAT Gateway flow logs, see StandardV2 NAT Gateway Flow Logs.