Note
Access to this page requires authorization. You can try signing in or changing directories.
Access to this page requires authorization. You can try changing directories.
Omnichannel for Customer Service offers a suite of capabilities that extend the power of Dynamics 365 Customer Service Enterprise to enable organizations to instantly connect and engage with their customers across digital messaging channels. An additional license is required to access Omnichannel for Customer Service. For more information, see the Dynamics 365 Customer Service pricing overview and Dynamics 365 Customer Service pricing plan pages.
The Summary report shows customer conversations over time by channel or queue. This report shows all omnichannel type queues, like messaging, live chat, and phone, except entity record type queues. View entity record type queues in real-time analytics for record routing reports. Statistics about the channel a conversation comes from help you analyze and manage queue distribution. For example, a high rate of abandoned conversations can decrease customer satisfaction. To fix abandoned conversations, examine operational metrics like customer service representative (service representative or representative) availability and queue distribution in real time. Learn how to access the report.
Track customer sentiment to learn if customers get enough support. For example, a high average handle time might mean service representatives take longer than needed to fix customer issues. Depending on the issue, provide training or support to help service representatives fix customer issues faster.
Filter this report by time, channel, queue, time zone, conversation status, and skills. Learn more in Overview of the real-time Omnichannel analytics dashboard.
Edit the visual display to add metrics to those already shown on the Summary report. Learn more in Customize visual display.
Learn more about the metrics that are shown on the Summary report.
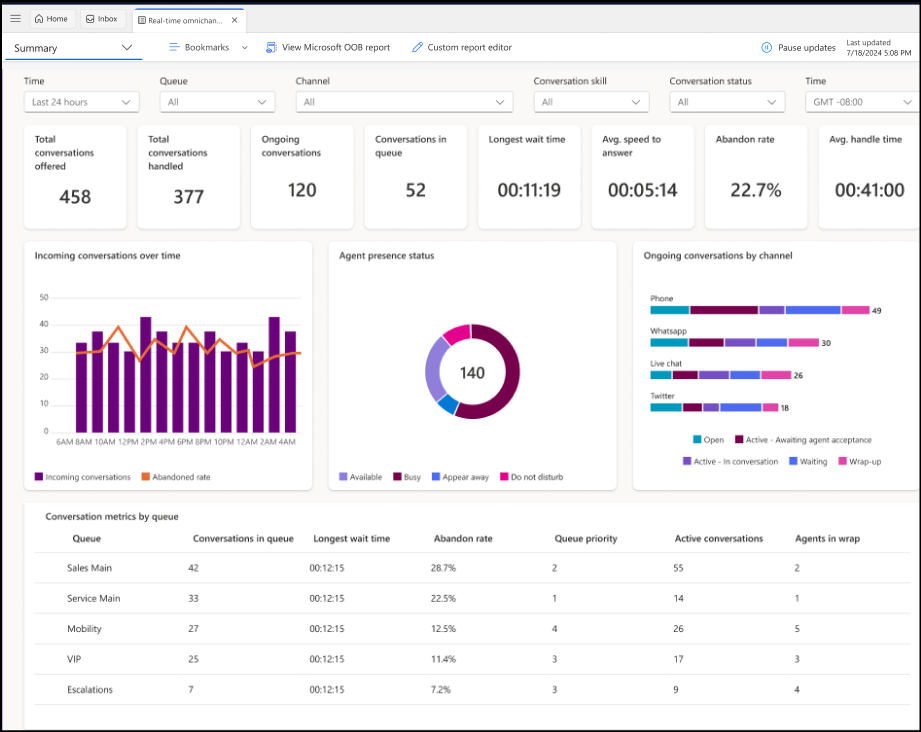
Interactive charts
View different types of charts on the report, like bar, horizontal bar, and donut charts. The visual display helps you spot changes and patterns in the data, so you can act quickly to address the most important issues.
When you select a component in a chart, the data filters accordingly. This way, you see only data related to the selected component. For example, if you select the Busy component in the Agent availability status chart, the dashboard refreshes and shows only the service representatives who are currently in the Busy state.
Drill-down reports
Drill down to sections of a report to find the data that interests you most. This section describes the two drill-down reports you view on the Summary report.
Conversations over time drill-down report
To view conversation analytics, select the Show more link on the Conversations over time KPI. You can drill through the conversations over time and analyze data by selecting the Channel or Queue tab.
Agent availability status drill-down report
To view more details about service representative analytics by queue, select the Show more link on the Agent availability status KPI. You can drill through agent analytics by:
Availability status
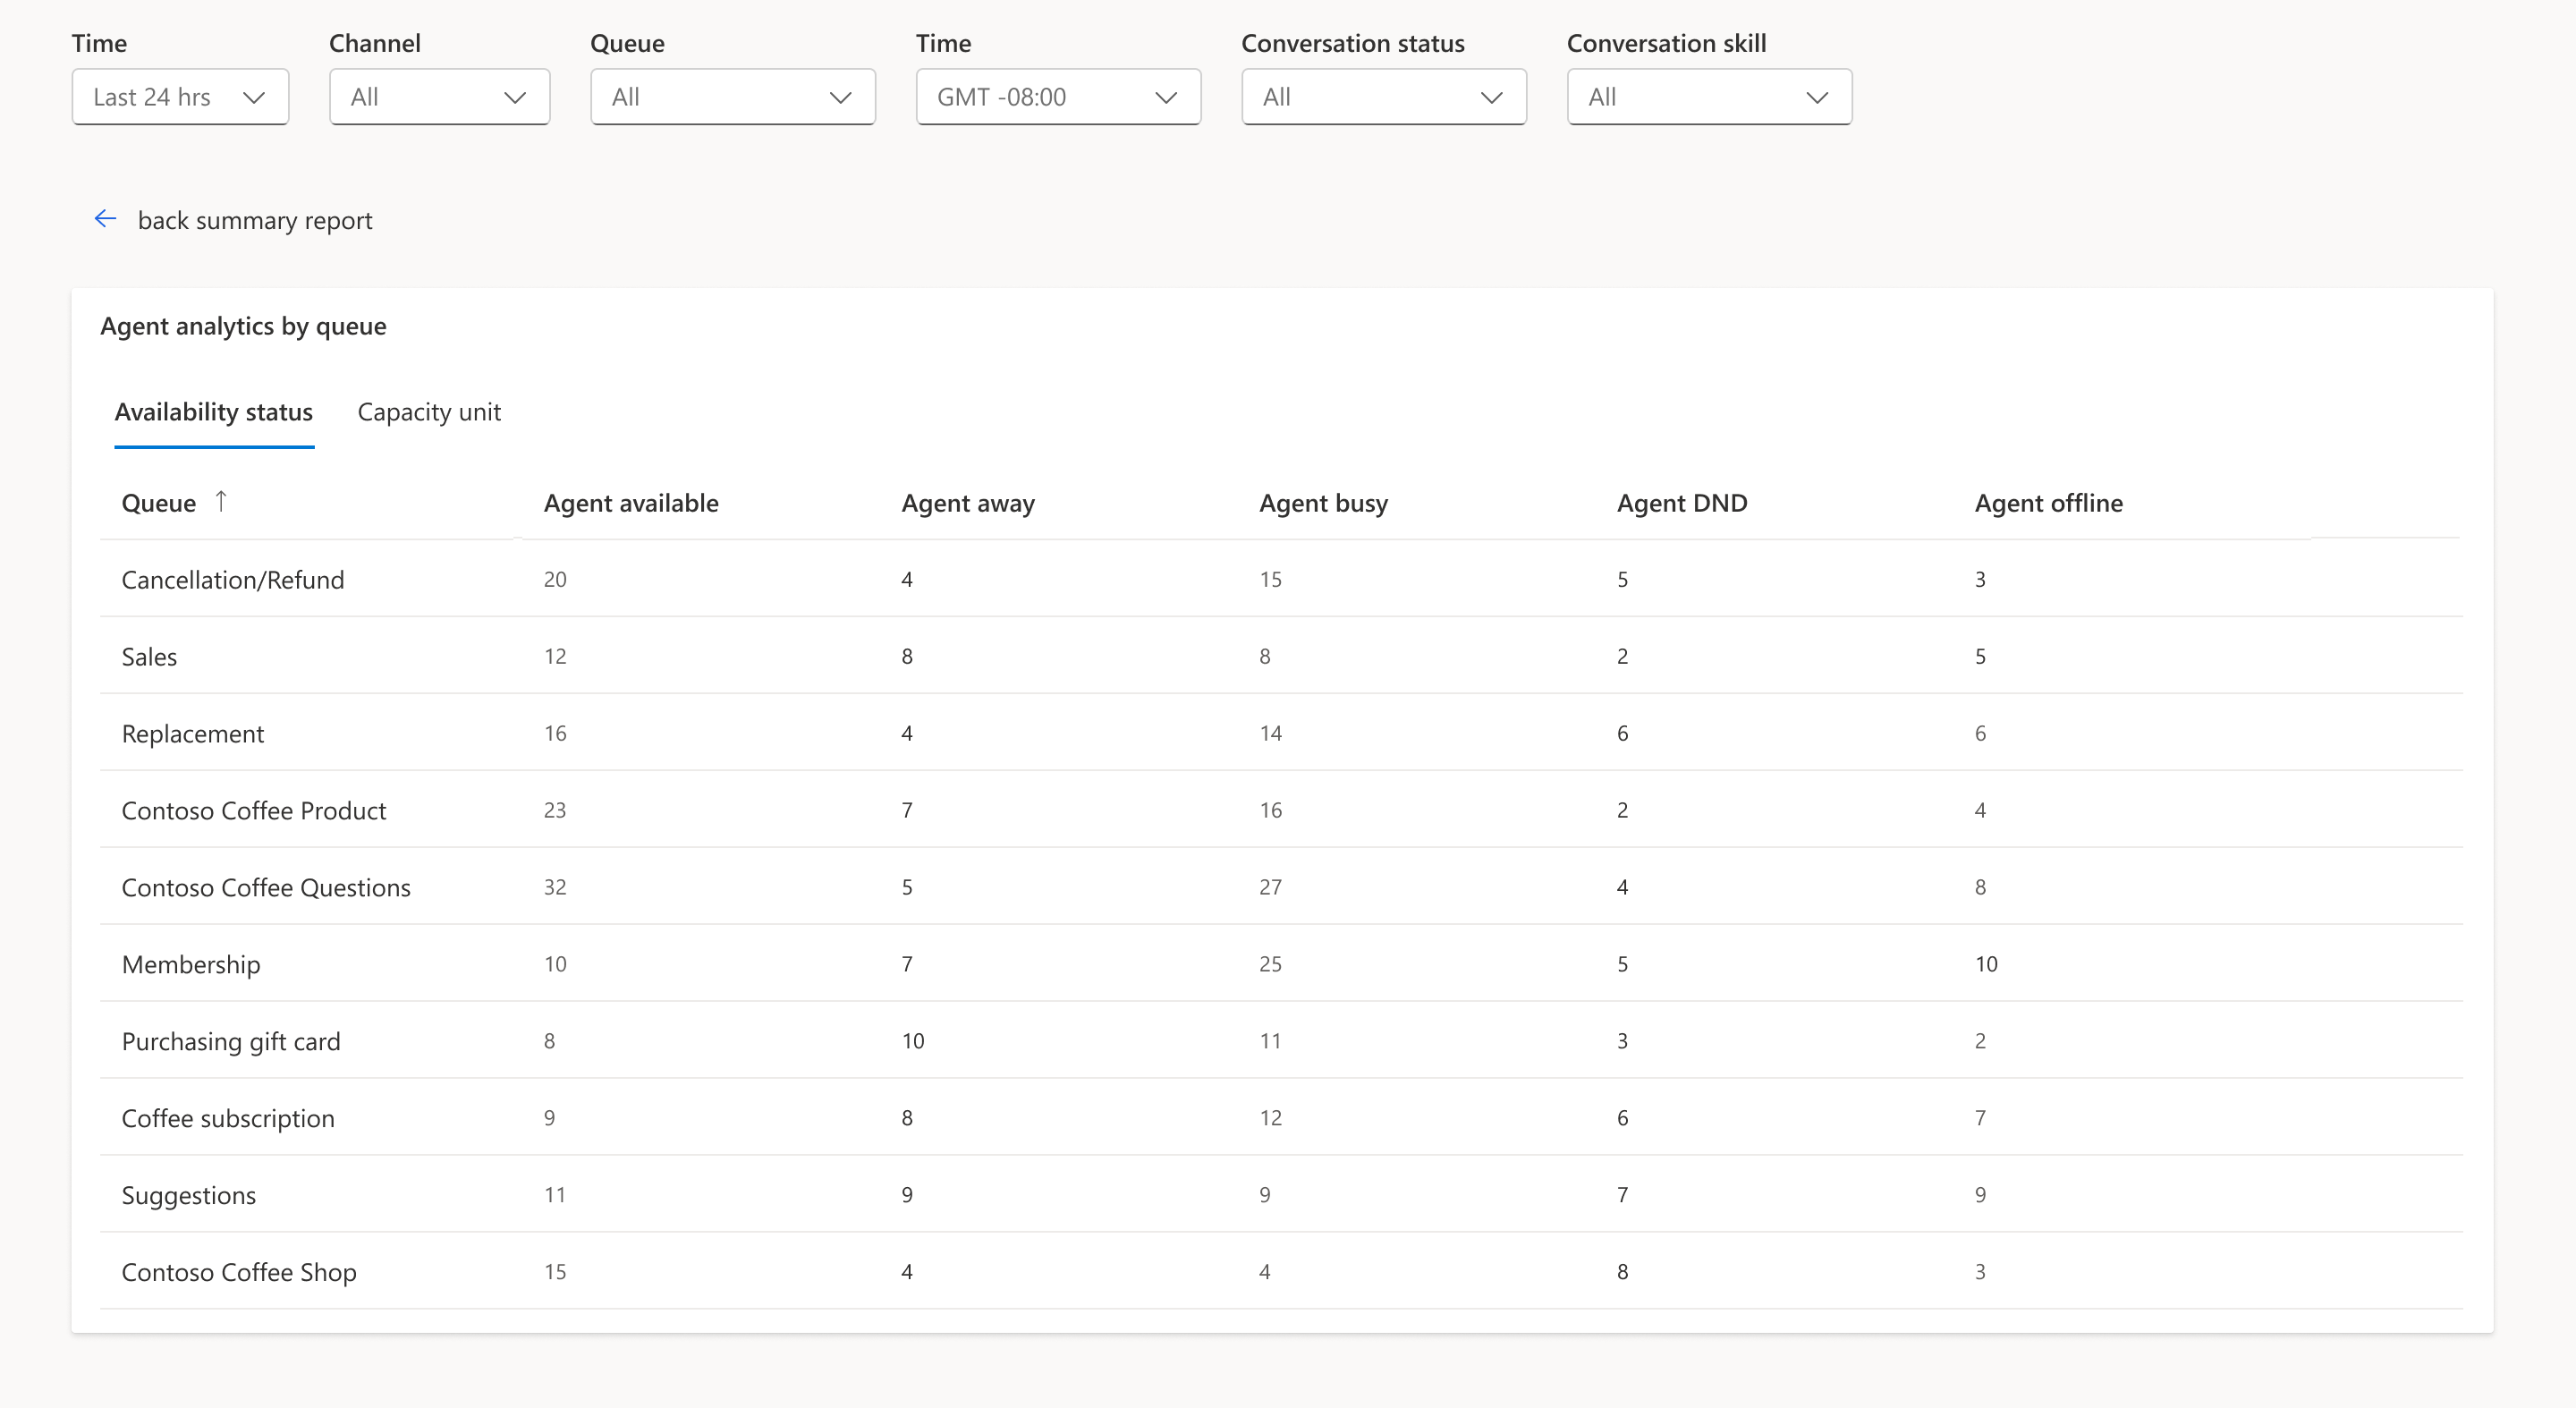
Capacity unit
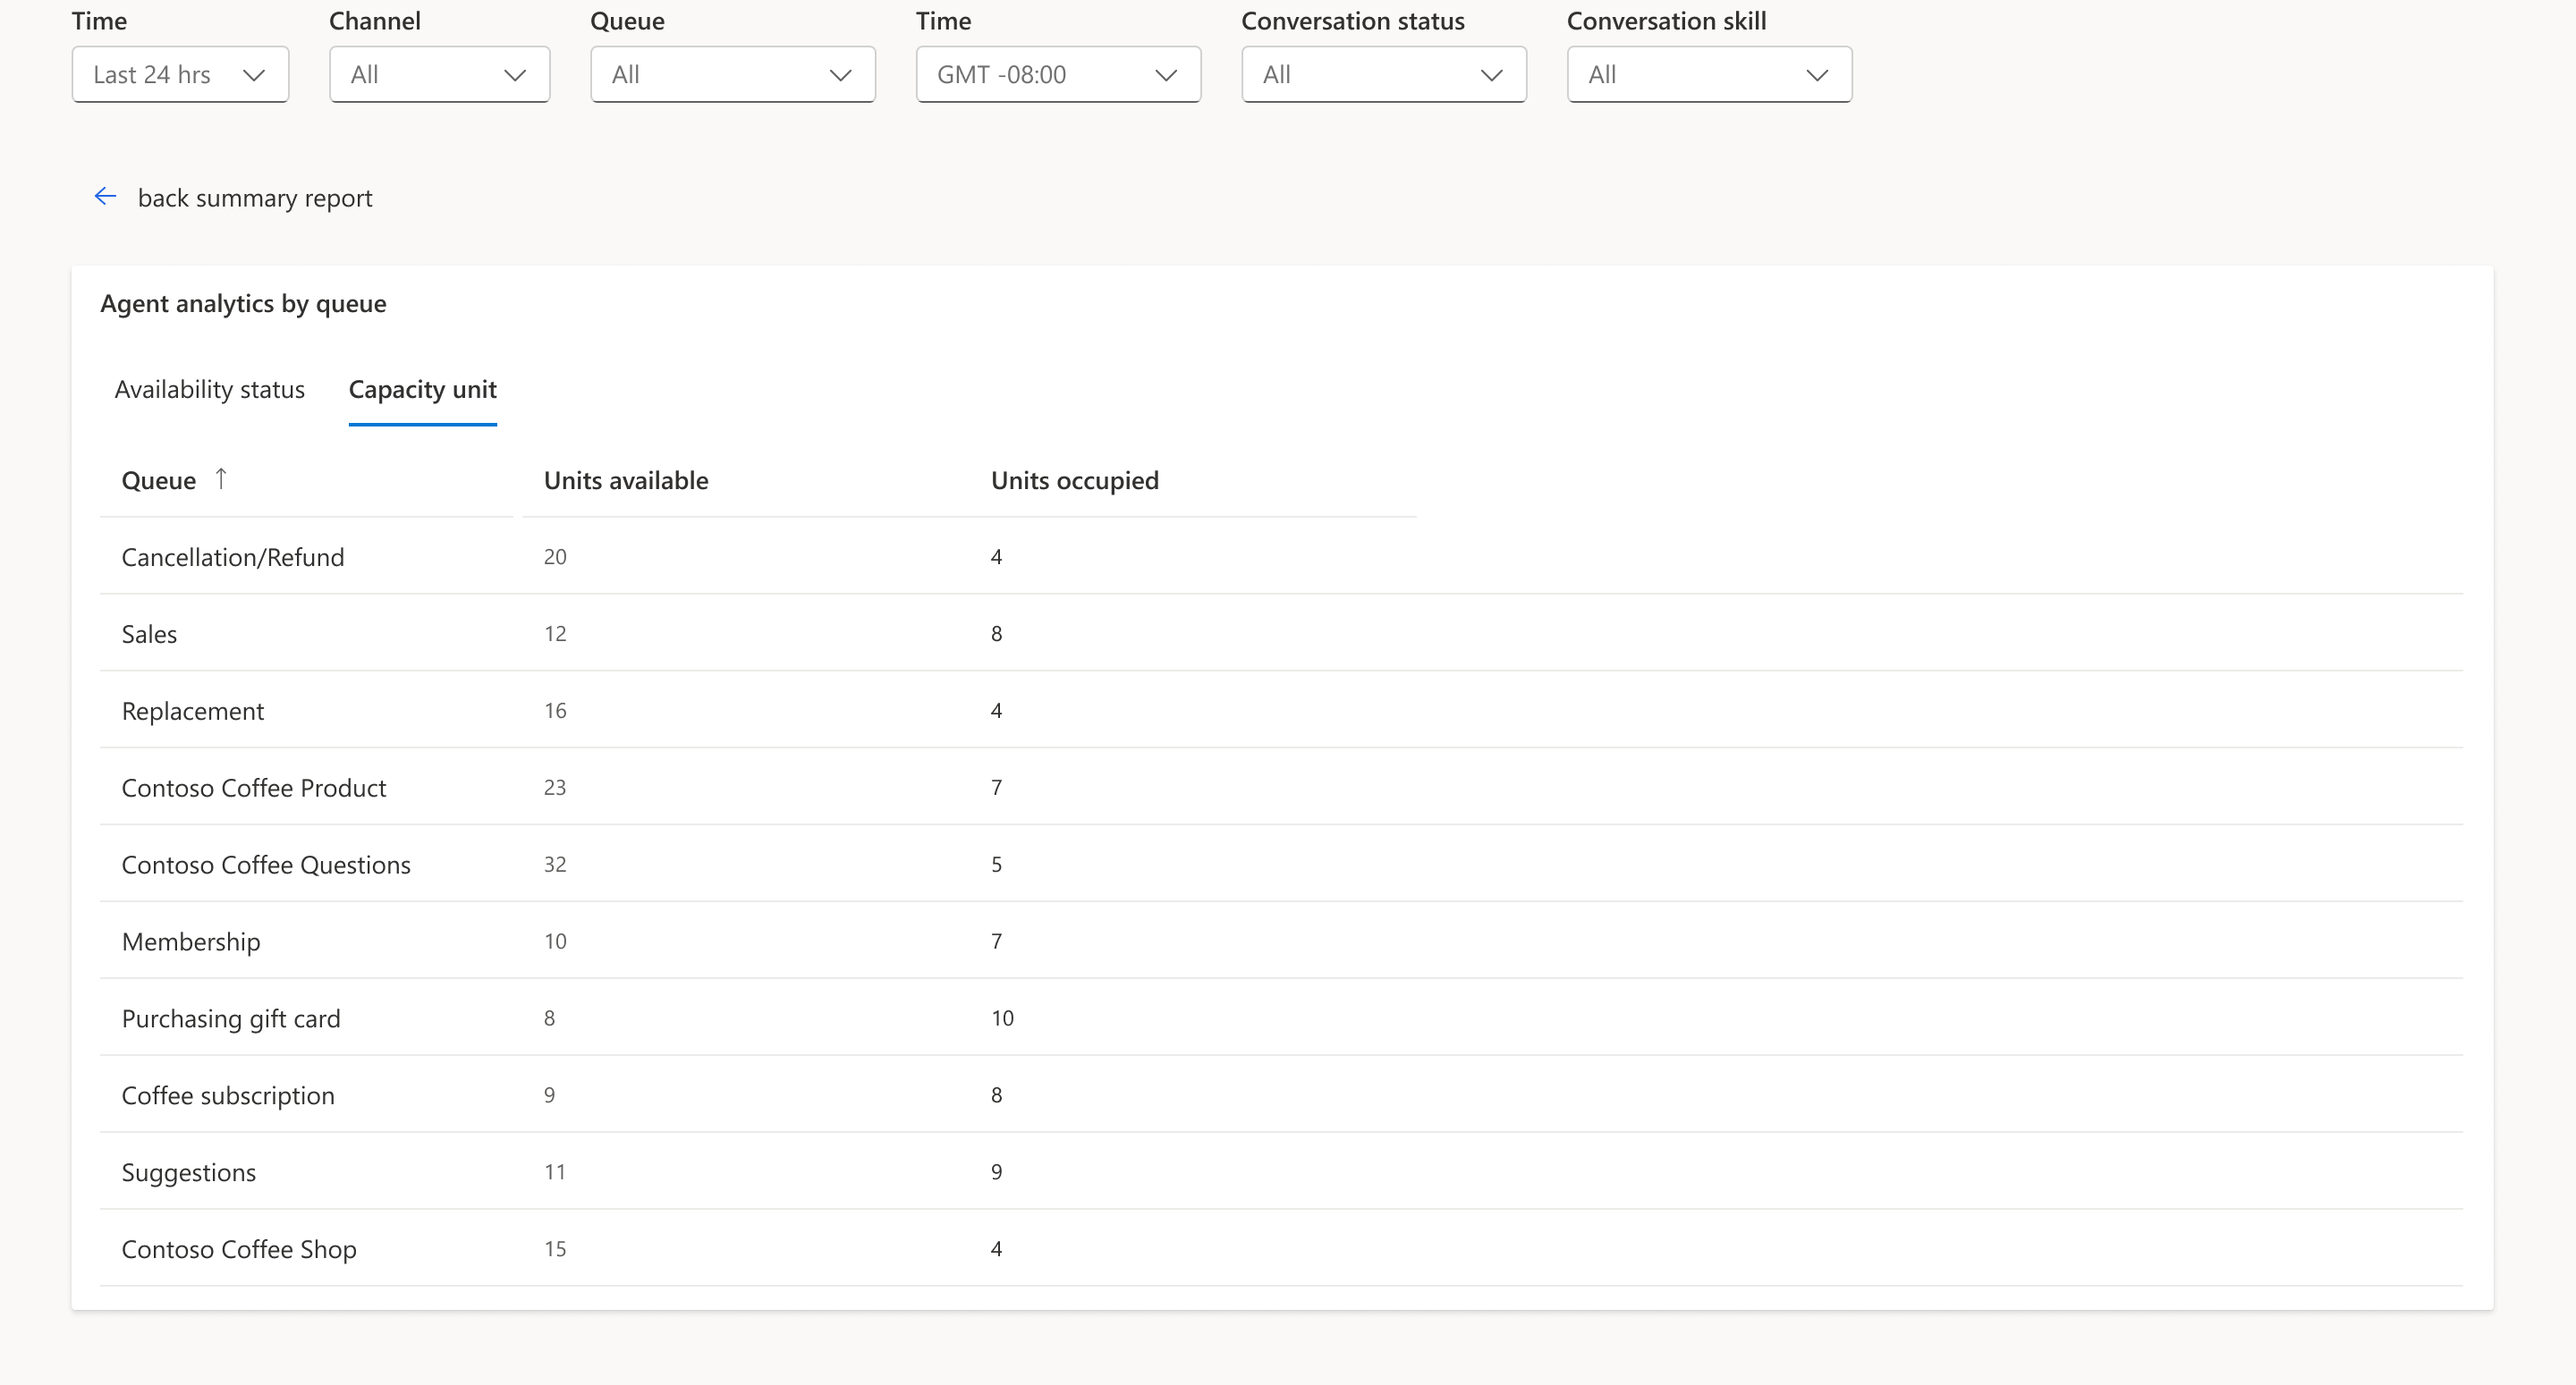
These tabs help you effectively manage service representative activity in real time.
Related information
Use Omnichannel for Customer Service metrics
Manage real-time analytics reports in Omnichannel for Customer Service
Overview of Omnichannel real-time analytics dashboard
View and understand the Voice report in Omnichannel real-time analytics
View and understand the Agents report in Omnichannel real-time analytics
View and understand the Ongoing conversation report in Omnichannel real-time analytics