Note
Access to this page requires authorization. You can try signing in or changing directories.
Access to this page requires authorization. You can try changing directories.
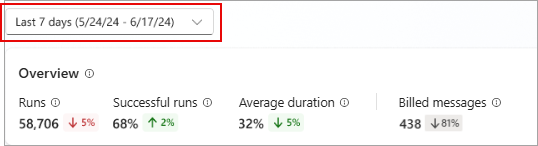
The Analytics page in Copilot Studio provides an aggregated insight into the overall health of your agent with event triggers across analytics sessions. The page also displays an Overview area that provides high-level, key performance indicator (KPI) metrics for your agent, a Savings area that analyzes time and cost savings attributable to your agent or your agent's tools, and a Summary area that provides key analytic insights into your agent's performance.
For more information about:
- The Summary and Overview areas, see Analytics overview
- The Savings area, see Analyze time and cost savings for agents
There are four core areas to focus on when reviewing and improving autonomous agent performance:
- Run outcomes: Knowing the end result of a session started by a trigger helps you begin to identify where your agent is succeeding and where it needs improvement.
- Trigger use: Seeing which triggers are used and how often helps you understand what your agent is doing and why.
- Tool use: Learning how often tools are used and how often they succeed can help you understand if those tools are useful and successful.
- Knowledge source use: Learning how often individual knowledge sources are used and how often the agent returned errors.
To change the time range, select the range dropdown at the top of the Analytics page. You can view analytics for sessions that occurred in the last 90 days.
Run outcomes
The Run outcomes section shows a chart that tracks the type of outcome for each session.
To download run outcome data (data visualized in the graph), select the menu icon ![]() and select Download CSV.
and select Download CSV.
You can also see a breakdown of session durations. Select See details on the Run outcomes chart. A side panel opens with the average duration for successful runs and failed sessions and how the length of sessions changed over time.

Long session durations can cause delays in workflows your agent is a part of. You can improve your agent's speed by providing more specific instructions at the trigger or agent level.
Trigger use
The Trigger use section shows a chart and metrics that track how often each trigger initiated a session. The chart shows the change in trigger use over time.
Select See details to view a breakdown of all triggers used during the selected time period, the most common events that triggered a run, and which events resulted in the most failed runs.
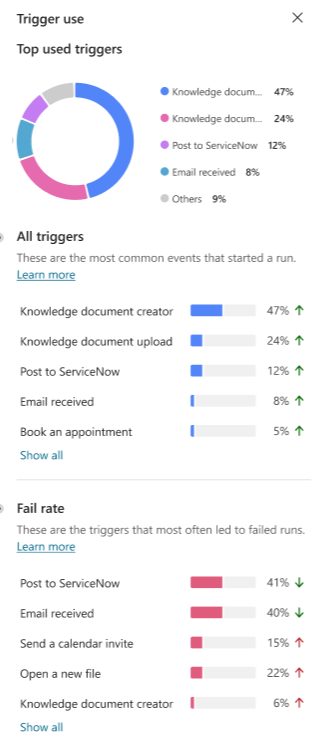
You can use this information to target specific runs for improvements, and understand which kind of events your agents responds to the most.
Tool use
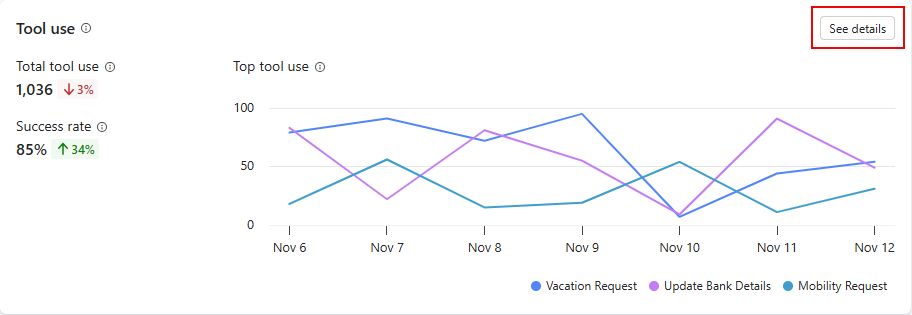
The Tool use section shows a chart and metrics that track how often your tools are started over time, and how often your agent used those tools successfully. It also shows trend indicators for how often your agent uses each tool and the percentage of called tools used successfully.
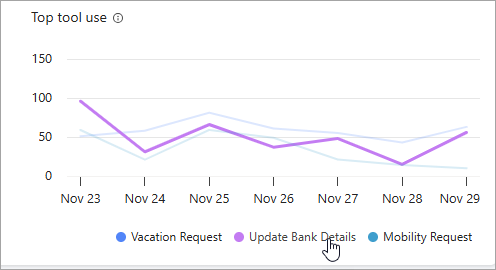
The chart displays the top five tools used over the date period defined at the top of the Analytics page.
In the legend below the chart, hover over any of the tools to highlight that tool in the chart.
To open a side panel with a list of all tools used in the specified time period, along with trend indicators, select See details on the chart. On the Tool use panel, you can display calculations of the percentage of questions used for each tool. If your agent has child agents, you can choose to display calculations for both the main agent and child agents (All), the Main agent only, or the Child agent only.

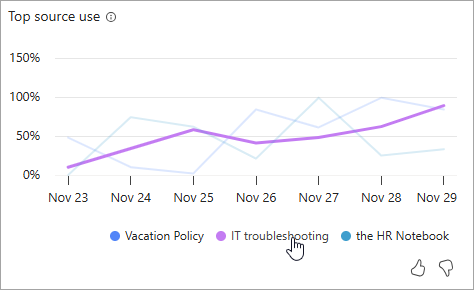
Knowledge source use
The Knowledge source use section shows a chart and metrics that track how often your knowledge sources are used by your agent. It also shows trend indicators for how often your sources are being used, how many errors are being generated, and how many times the source is being used.
The chart displays the top five knowledge sources used over the date range defined at the top of the Analytics page.

In the legend below the chart, hover over any of the knowledge sources to highlight that knowledge source in the chart.
Select See details to open a side panel with knowledge source usage and error rates over your selected time period. You can use these charts to identify which knowledge sources work well to help users, and which to target for improvements.
On the side panel, select All to display metrics for both the main agent and child agents, Main agent for metrics about the main agent only, or Child agent for metrics about child agents only.
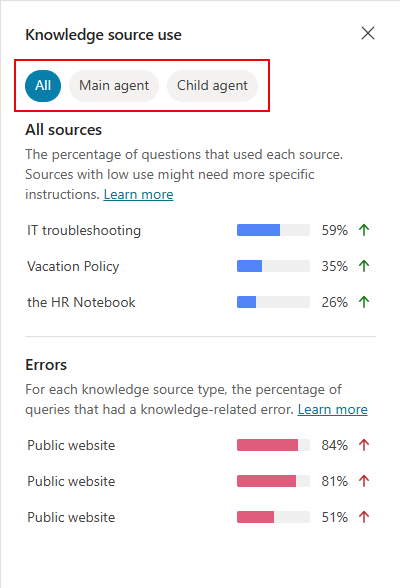
- All sources shows the percentage of sessions that used each knowledge source the agent has access to.
- Errors shows the percentage of sessions that used each knowledge source type (for example, SharePoint) that resulted in an error.
Under All sources, to see more information at the level of any one of the listed knowledge sources, select an individual source. The tooltip includes:
- The total number of questions that referenced this knowledge source as well as the number of thumbs up and thumbs down reactions.
- A stacked bar chart showing the breakdown of the quality of response relative weightings for questions referencing this knowledge source. Hover over any segment of the bar chart to see the value of that segment's relative weighting and the number of questions sampled to arrive at that value.
