Note
Access to this page requires authorization. You can try signing in or changing directories.
Access to this page requires authorization. You can try changing directories.
The MSSQL extension for Visual Studio Code supports developers building applications that use Azure SQL (including Azure SQL Database, Azure SQL Managed Instance, and SQL Server on Azure Virtual Machines), SQL database in Fabric, and SQL Server. It provides tools for connecting to databases, managing and designing schemas, exploring database objects, executing Transact-SQL queries, and viewing query execution plans within Visual Studio Code.
The extension includes advanced IntelliSense, Transact-SQL script execution, and customizable options to support SQL development for local and cloud-based databases.
Install the MSSQL Extension in Visual Studio Code
To get started with SQL development in Visual Studio Code, install the MSSQL extension:
- Open Visual Studio Code.
- Select the Extensions icon in the Activity Bar (Cmd+Shift+X on macOS, or Ctrl+Shift+X on Windows and Linux).
- In the search bar, type
mssql. - Find SQL Server (mssql) in the results and select it.
- Select the Install button.
Tip
You know the extension is installed correctly when the MSSQL icon appears in the Activity Bar and the Connections view becomes available.
Modern UI
The MSSQL extension for Visual Studio Code elevates the SQL development experience across SQL Server, Azure SQL, and SQL database on Fabric.
This experience delivers the following integrated features, which are enabled by default:
- Connection Dialog
- Object Explorer (filtering)
- Table Designer
- Query Results Pane
- Query Plan Visualizer
Note
To use preview features, including View & Edit Data (Preview), enable the mssql.enableExperimentalFeatures setting in Visual Studio Code. Under Settings > MSSQL configuration, select the Enable Experimental Features checkbox. Restart Visual Studio Code for the setting to take effect.
Connection dialog
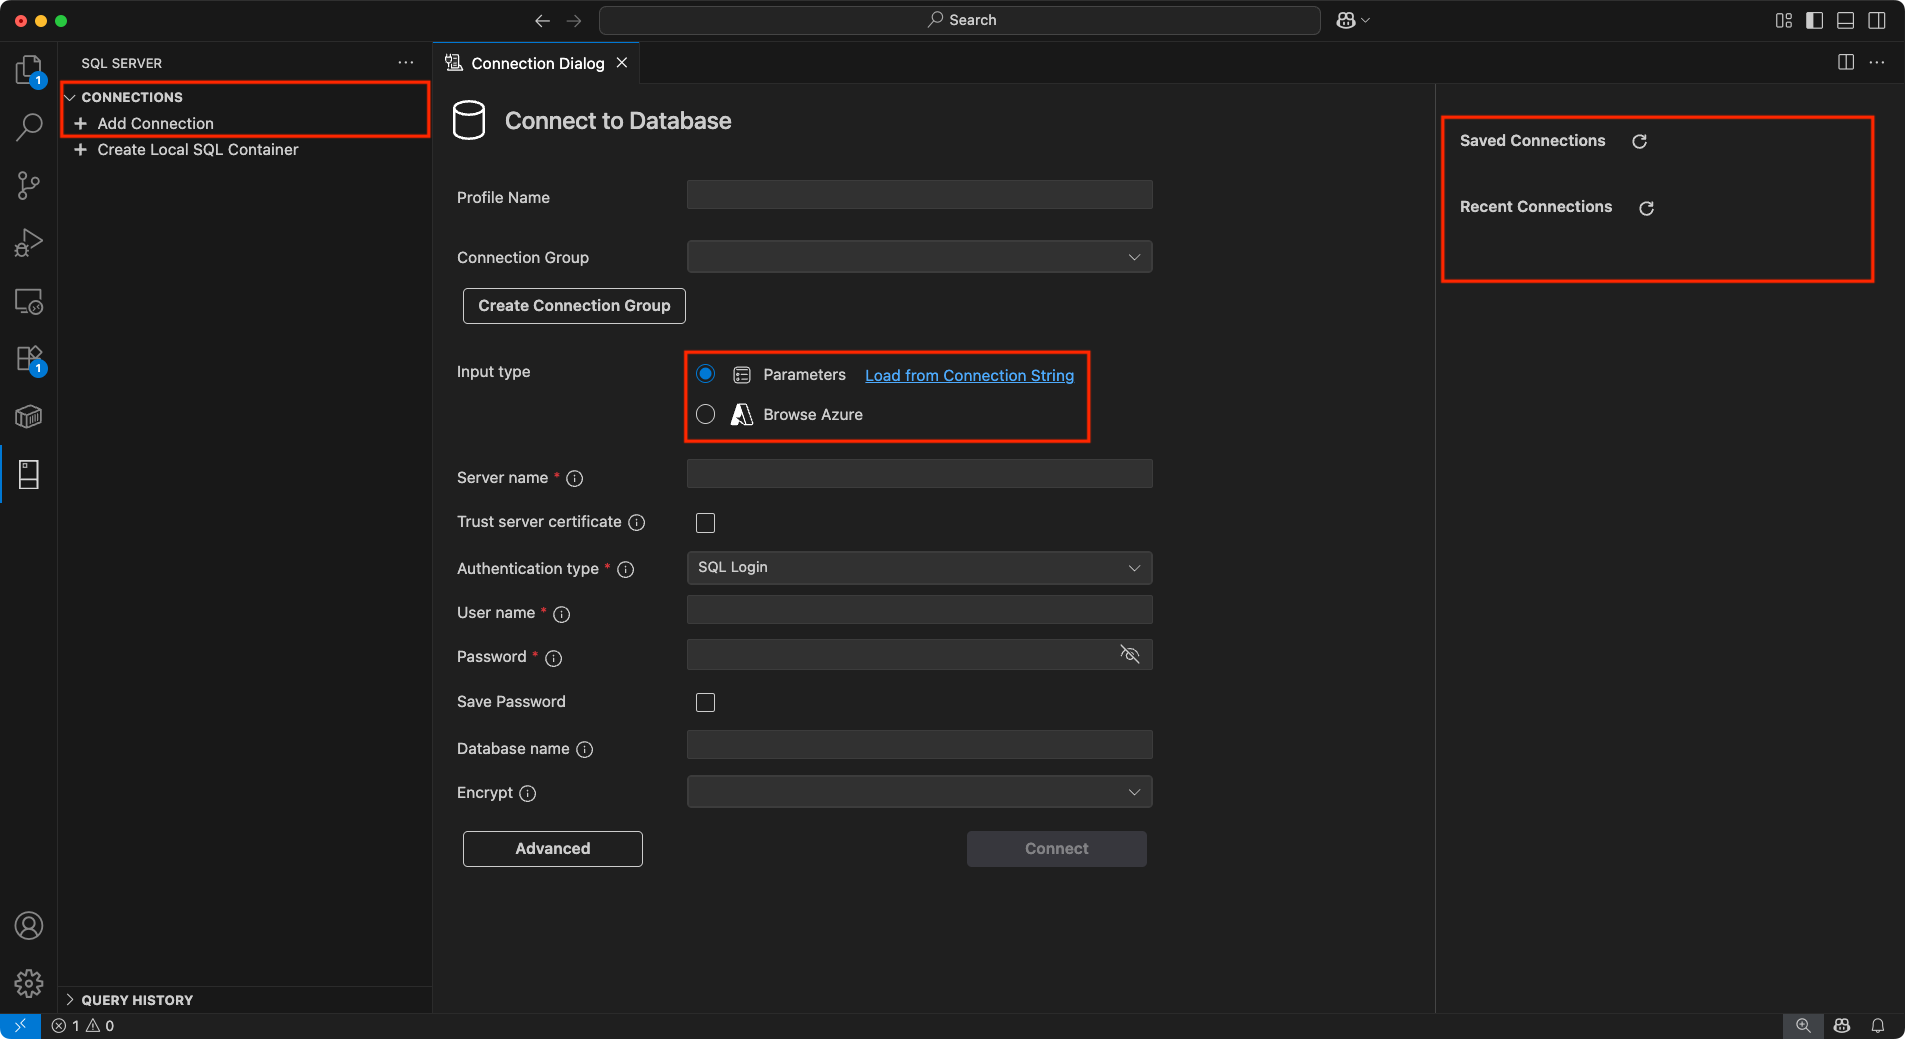
The Connection dialog provides a simple and intuitive interface for connecting to databases hosted in Azure SQL (including Azure SQL Database, Azure SQL Managed Instance, and SQL Server on Azure VMs), SQL database in Fabric, or SQL Server. It offers multiple input options to cater to different scenarios:
Parameters: Enter individual connection details such as server name, database name, username, and password.
Connection String: Directly input a complete connection string for more advanced configurations.
Browse Azure: Browse available database instances and databases in your Azure account, with options to filter by subscription, resource group, and location.
Connection Groups: Organize environments by grouping connections into folders and assigning colors for quick visual identification. Easily assign or change a group when creating or editing a connection.
The connection dialog includes Saved Connections and Recent Connections panels to simplify reconnecting to previously used servers. The layout supports editing and saving connection details and makes it easy to switch between servers or databases.
Object Explorer (filtering)
The Object Explorer lets you explore your database objects, such as databases, tables, views, and programmability items. The enhanced filtering functionality makes it easier to find specific objects within large and complex database hierarchies:
Apply Filters: Filter database objects by properties like name, owner, or creation date. You can apply filters at multiple levels, including databases, tables, views, and programmability.
Edit Filters: Refine or update existing filters to further narrow the object list.
Clear Filters: Remove applied filters to view all objects within the hierarchy.
These filters give you flexibility and control, making it easier to manage large databases and find relevant objects.
Table Designer
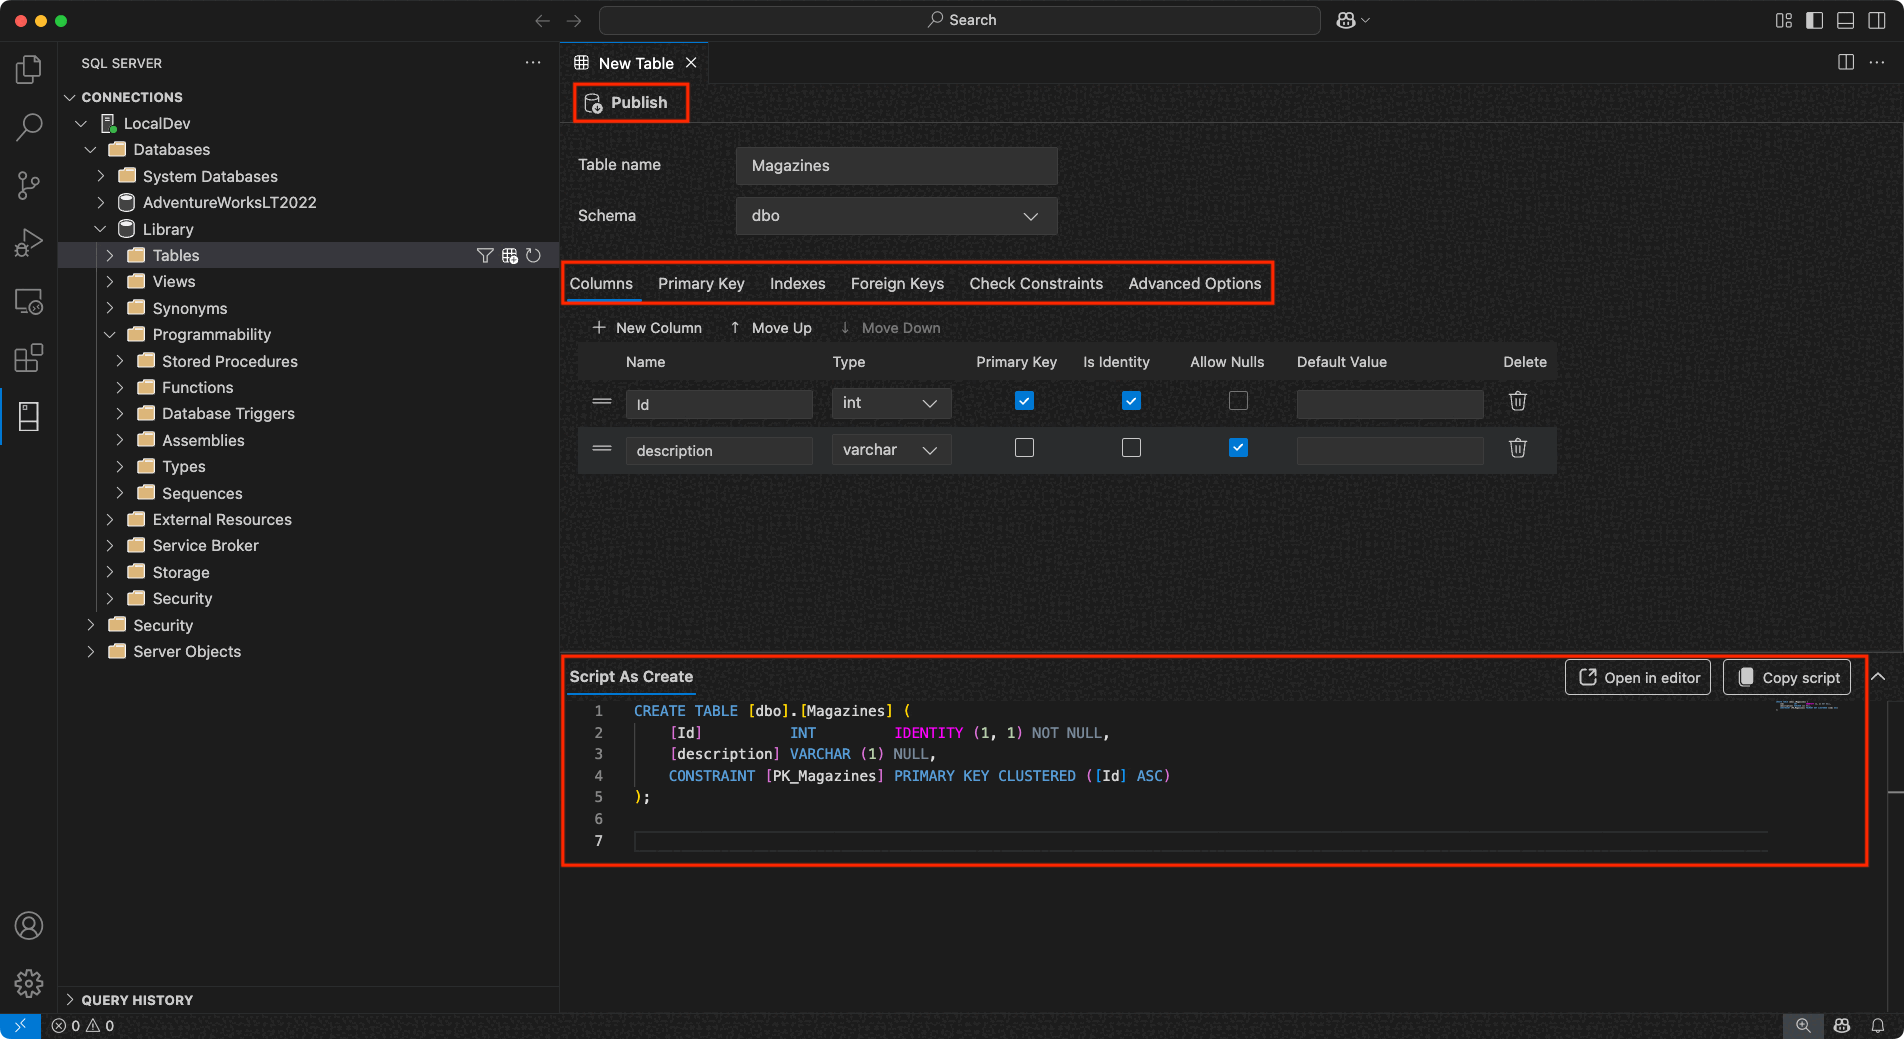
The Table Designer provides a UI for creating and managing tables for your databases. It offers advanced capabilities to customize every aspect of the table's structure:
Columns: Add new columns, set data types, define nullability, and specify default values. You can also designate a column as a primary key or identity column directly within the interface.
Primary Key: Define one or more columns as the primary key for your table, ensuring each row is uniquely identifiable.
Indexes: Create and manage indexes to improve query performance by adding extra columns as indexes for faster data retrieval.
Foreign Keys: Define relationships between tables by adding foreign keys referencing primary keys in other tables, ensuring data integrity across tables.
Check Constraints: Set up rules to enforce specific conditions on the data being entered, such as value ranges or patterns.
Advanced Options: Configure more sophisticated properties and behaviors, such as system versioning and memory optimized tables.
Within the designer, the Script As Create panel provides an automatically generated T-SQL script that reflects your table design. You have the following options:
Publish: Apply your changes directly to the database by selecting Publish. This action is powered by DacFX (Data-tier Application Framework), which ensures the smooth and reliable deployment of your schema updates.
Copy script: Copy the generated T-SQL script from the preview panel for manual execution or open it directly in the editor for further adjustments and modifications as needed.
View & Edit Data (Preview)
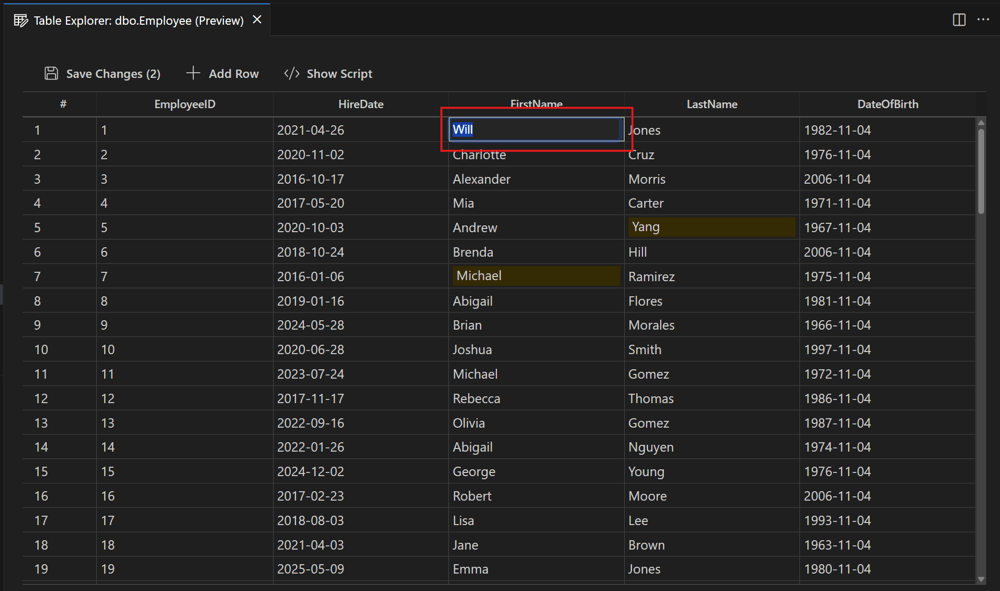
View & Edit Data (Preview) provides an intuitive, interactive way to browse and modify table data directly within the editor without writing Transact-SQL data manipulation language (DML) statements. Developers can interact with their data in an intuitive interface, simplifying everything from quick edits to in-depth validation.
To use this feature, right-click a table in Object Explorer and select View & Edit Data (Preview). The table data opens in a data grid within a new editor tab, displaying the contents in a familiar, spreadsheet-like layout with paging controls based on the configured rows per page.
Key capabilities include:
Inline editing: Update cell values directly within the grid. Edits are validated in real time and return an error message for incorrect inputs, such as invalid data types or violations of a constraint. The grid highlights the cell with the incorrect input in red.
Add and delete rows: Insert new rows or delete existing ones, so you can quickly adjust data during development and testing.
Pagination: Efficiently load and navigate large datasets using built-in paging controls for smooth scrolling and performance.
Save Changes: All edits remain in a pending state until you select Save Changes, giving you complete control over when updates are committed to the database.
Show Script: This pane displays a read-only DML script that reflects all actions performed in the data grid in real time. This allows you to review the underlying DML operations before saving changes
Query Results pane
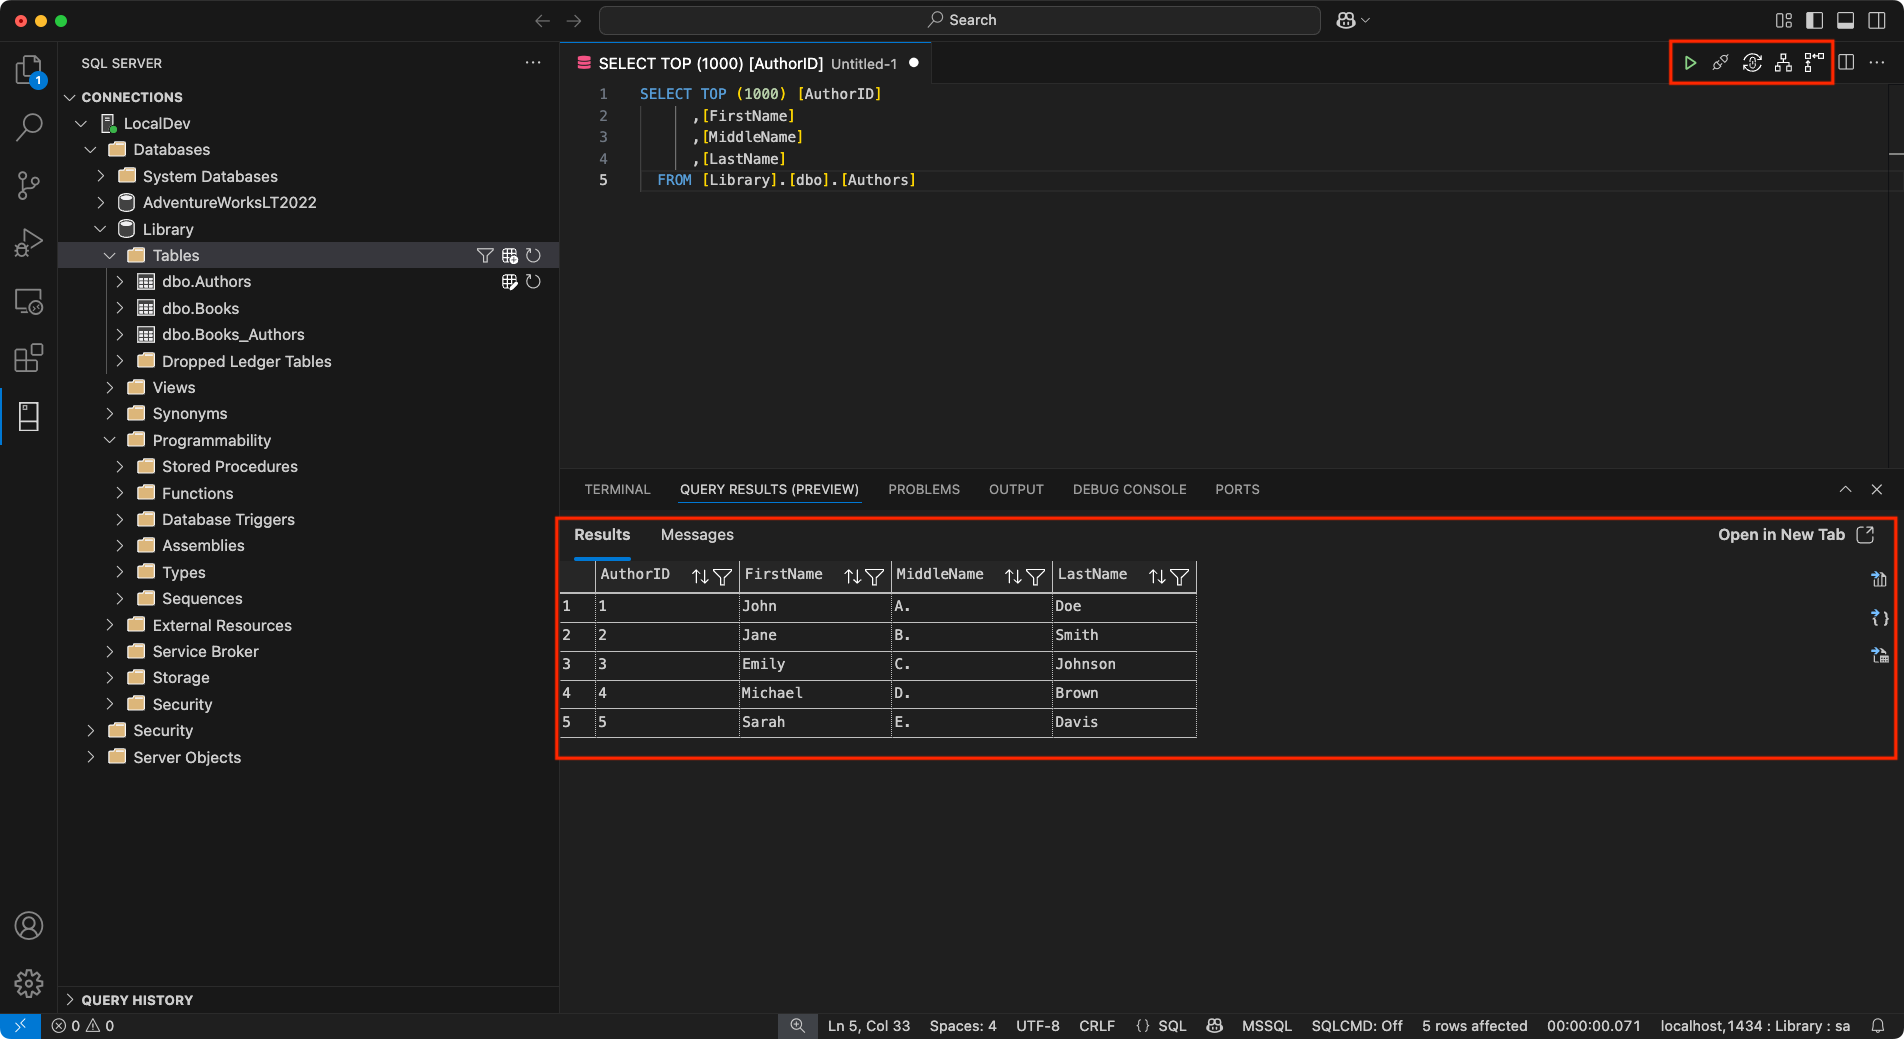
The MSSQL extension for Visual Studio Code provides an enhanced query results experience, helping you efficiently visualize and understand your data output. The query results display within the bottom panel of Visual Studio Code, which also hosts the integrated terminal, output, debug console, and other tools, creating a unified interface for easy access.
Tip
You can open query results in a new tab for an expanded view, similar to the previous experience.
Key features of the Query Results pane include:
Grid View: Displays query results in a familiar grid format, so you can easily inspect the data. You can display results in a new tab for a clearer, more organized view.
Copy Options: Right-click within the results grid to access options like Select All, Copy, Copy with Headers, and Copy Headers, making it convenient to transfer data for other uses.
Save Query Results: Includes the ability to save query results to multiple formats such as JSON, Excel, and CSV, so you can work with the data outside of Visual Studio Code.
Inline Sorting: You can sort the data by selecting the column headers directly in the query results view. Sorting can be done in ascending or descending order to make it easier to analyze specific subsets of the data.
Estimated Plan: The Estimated Plan button is located in the query toolbar, next to the Run Query button. It appears as a flowchart icon and allows you to generate an estimated execution plan without executing the query itself. This feature provides valuable insight into query performance, helping identify potential bottlenecks and inefficiencies before running the actual query.
Enable Actual Plan: A button labeled Enable Actual Plan, located right after Estimated Plan button in the upper right corner of the results pane, lets you view the actual query plan for executed queries. This addition provides deeper insight into query performance and helps identify bottlenecks and inefficiencies.
This query results experience supports common workflows for viewing and working with result sets.
Tip
You can customize the query results behavior using the mssql.openQueryResultsInTabByDefault setting. When set to true, query results open in a new tab by default, helping declutter your workspace.
Query Plan Visualizer
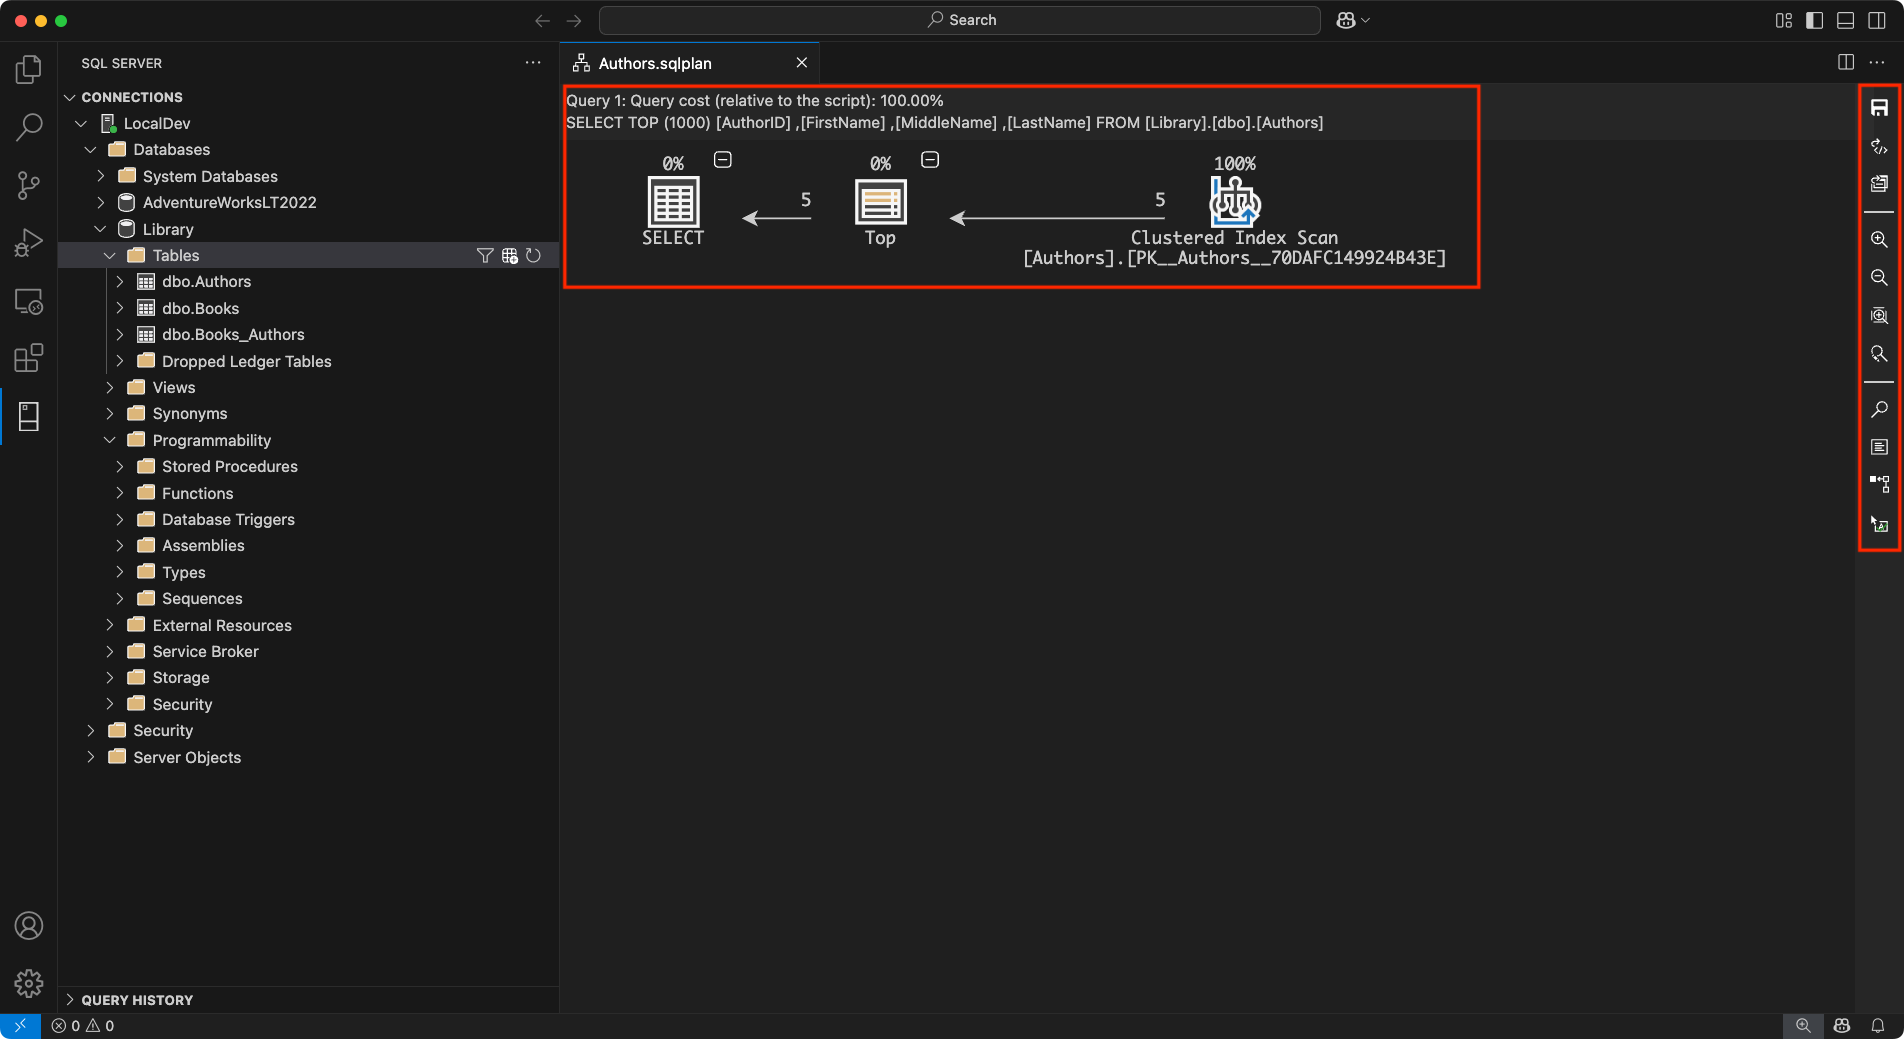
Use the Query Plan Visualizer in the MSSQL extension for Visual Studio Code to analyze SQL query performance by viewing detailed execution plans. This tool provides insights into how SQL queries run, so you can identify bottlenecks and optimize your queries.
Key features and capabilities include:
- Node Navigation: Each step in the execution plan appears as a node. You can interact with the plan in different ways. Select nodes to view tooltips or detailed information about specific operations. Collapse or expand node trees to simplify the view and focus on key areas of the query plan.
- Zoom Controls: The visualizer offers flexible zoom options to help you analyze the plan in detail. You can zoom in or out to adjust the level of detail. Use the "zoom to fit" feature to resize the view and fit the entire plan on your screen. Set custom zoom levels to examine specific elements precisely.
- Metrics and Highlighting: The metrics toolbar helps you analyze key performance indicators and highlight expensive operations. Select metrics such as Actual Elapsed Time, Cost, Subtree Cost, or Number of Rows Read from the dropdown list to identify bottlenecks. Use these metrics to search for specific nodes within the query plan for deeper analysis.
The right-hand sidebar provides quick access to more actions:
- Save Plan: Save the current execution plan for future reference.
- Open XML: Open the XML representation of the query plan to inspect details at the code level.
- Open Query: View the query that generated the execution plan directly from the toolbar.
- Toggle Tooltips: Enable or disable tooltips for more details on each node.
- Properties: View the properties of each node in the execution plan, with options to sort by importance or alphabetically.
Supported operating systems
Currently, this extension supports the following operating systems:
- Windows (x64, x86, Arm64)
- macOS (x64, Arm64)
- Linux Arm64
- Ubuntu 18.04, 20.04, 22.04
- Debian 10, 11, 12
- CentOS 7, 8 / Oracle Linux 7, 8
- Red Hat Enterprise Linux (RHEL) 8, 9
- Fedora 35, 36
- OpenSUSE Leap 15
Offline installation
The extension can download and install a required SqlToolsService package during activation. You can still use the extension for machines with no Internet access by choosing the Install from VSIX... option in the Extension view and installing a bundled release from the Releases page. Each operating system has a .vsix file with the required service included. Pick the file for your OS, download, and install it to get started. Choose a full release and ignore any alpha or beta releases, as these are daily builds used in testing.
Feedback and support
If you have ideas, feedback, or want to engage with the community, join the discussion at aka.ms/vscode-mssql-discussions. To report a bug, visit https://aka.ms/vscode-mssql-bug. To request a new feature, go to https://aka.ms/vscode-mssql-feature-request.

