Note
Access to this page requires authorization. You can try signing in or changing directories.
Access to this page requires authorization. You can try changing directories.
Note
To diagnose Always On availability group health issues that trigger availability group failover, see Troubleshoot Always On Availability Groups failover.
AGDiag is an application that automates the manual analysis of cluster logs, and correlates and reports pertinent events from the other logs (SQL Server error logs, Windows event logs, and so on). AGDiag generates a summary report of Windows Cluster and Always On health events, and provides more detailed analysis results for each health event that's detected. It also automates much of its work when you provide the appropriate logs from the availability group primary replica at the time of the health event.
Generate logs for AGDiag to diagnose
You can use various methods to generate the logs that AGDiag takes as inputs. AGDiag relies on the following base logs to do analysis:
- Windows Cluster Diagnostic logs
- SQL Server Error logs
- Windows System Event logs
- System Health Extended Events (XEL) files
- AlwaysOn Health Session XEL files
As an alternative method to manually collecting these logs, you can use either of the following log collection tools to capture them:
- LogScout
- TSS
Use SQL LogScout to capture logs for AGDiag analysis
To diagnose an availability group health event, use SQL LogScout to collect logs on the SQL Server instance that was in the primary role at the time of the event:
Download the latest SQL LogScout as a .zip file.
Save and extract the .zip file on the computer on which SQL Server hosts the primary replica. This system is where the failover started or the availability group was resolving.
Open an elevated PowerShell Command Prompt window, and change the directory to the SQL LogScout folder in which you extracted the .zip file.
Run the following command to capture the
Basicscenario, and follow the prompts..\SQL_LogScout.ps1 -Scenario "Basic" -ServerName "<Your_Sql_Instance_Name>"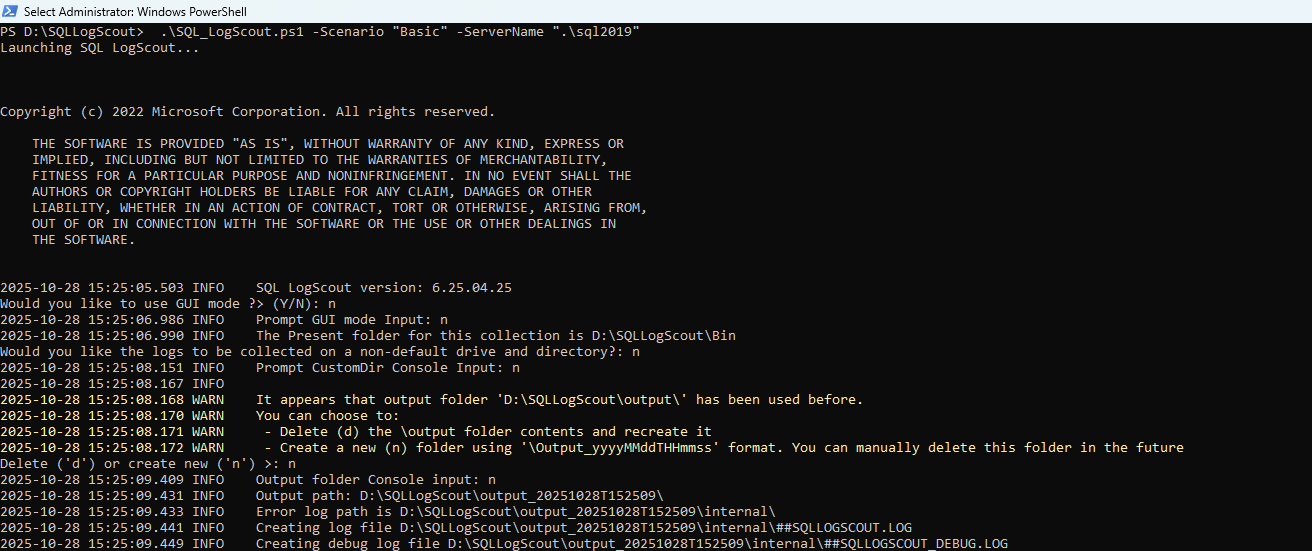
When the log capture process finishes, you can point AGDiag to the
\outputfolder that was created inside the SQL LogScout folder. This folder contains the logs that are collected by SQL LogScout.
Use TSS to generate logs for AGDiag to diagnose
Alternatively, you can capture the logs by using TSS on the SQL Server instance that was in the primary role at the time of the event:
Download the toolset (TSSv2.zip) as a .zip file. For more information, see Introduction to TroubleShootingScript toolset (TSSv2).
Save and extract the .zip file to a folder on the SQL Server instance that hosted the availability group primary replica when the failover started or the availability group was resolving.
Open an elevated Command Prompt window, change the directory to the TSS folder where you saved and extracted the TSSv2.zip file, run
TSS SDP:SQLBase, and respond to the prompts.
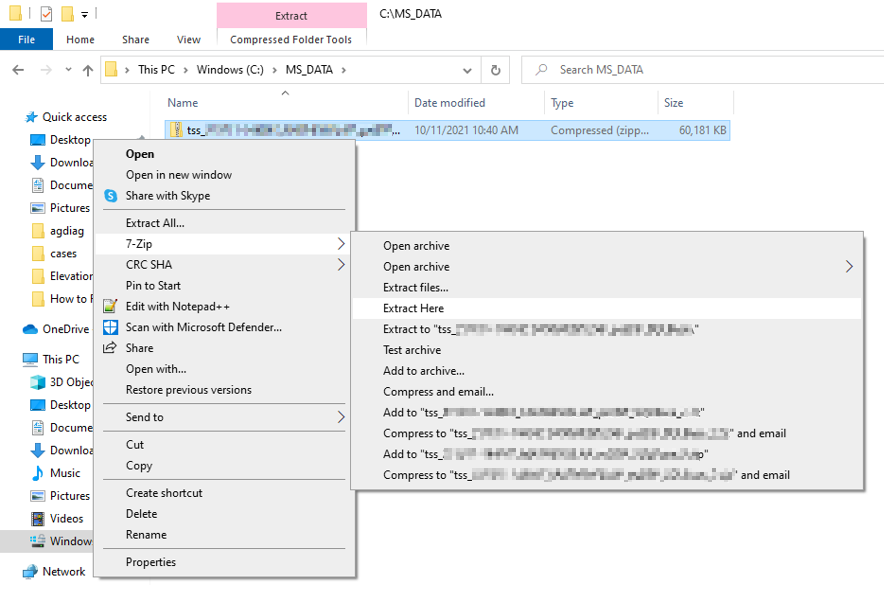
After TSS creates the SQLBase .cab file, extract the .cab file into a folder.


Download the AGDiag tool
To download AGDiag, follow these steps:
Select the agdiag.zip link to download the tool.


Start AGDiag and feed it the unzipped TSS logs
After you download the tool, follow these steps to launch AGDiag and feed it the unzipped TSS logs:
Extract the .zip file, and double-click agdiag.exe to start AGDiag.
A dialog box that resembles the following box appears.

Select Select Log Folder, drill into the folder that you extracted the TSS SQLBase .cab files into, and then select OK.

Interpret the AGDiag report
The default system browser opens the AGDiag report. The following illustrations help you interpret the report:
The following AGDiag Splash Screen describes AGDiag capabilities and version information.

AGDiag reports on the logs that it analyzes in the initialize section. To see more detailed information, select the triangles (highlighted in red boxes in the following image).

The summary report lists the availability group health events from the cluster log. To jump to a specific health event's detailed report, select the numerical link (highlighted in red box in the following image).

A detailed report exists for each health event that's detected. This report includes log findings that correlate to the health event, diagnosis, and recommendations. To see more detailed information, select the triangles (highlighted in red boxes in the following image).


Known issues in AGDiag
For the latest information about documented issues and possible solutions, see Known Issues with AGDiag.