Nuta
Dostęp do tej strony wymaga autoryzacji. Możesz spróbować się zalogować lub zmienić katalog.
Dostęp do tej strony wymaga autoryzacji. Możesz spróbować zmienić katalogi.
Gdy wizualizacja ma hierarchię, możesz zezwolić użytkownikom na korzystanie z funkcji przechodzenia do szczegółów usługi Power BI w celu wyświetlenia dodatkowych szczegółów.
Przeczytaj więcej na temat funkcji przechodzenia do szczegółów usługi Power BI w trybie przechodzenia do szczegółów w usługa Power BI. Aby umożliwić wizualizacji dynamiczne włączanie lub wyłączanie funkcji przechodzenia do szczegółów, zobacz Dynamiczne sterowanie przechodzeniem do szczegółów.
Włączanie obsługi przechodzenia do szczegółów w wizualizacji
Aby obsługiwać akcje przechodzenia do szczegółów w wizualizacji, dodaj nowe pole do capabilities.json nazwy drill-down. To pole ma jedną właściwość o nazwie roles , która zawiera nazwę elementu dataRole, dla którego chcesz włączyć akcje przechodzenia do szczegółów.
    "drilldown": {
        "roles": [
            "category"
        ]
    }
Uwaga
Element dataRole przechodzenia do szczegółów musi być Grouping typu.
max właściwość w warunkach dataRole musi być ustawiona na 1.
Po dodaniu roli do pola przechodzenia do szczegółów użytkownicy mogą przeciągać wiele pól do roli danych.
Na przykład:
{
    "dataRoles": [
        {
            "displayName": "Category",
            "name": "category",
            "kind": "Grouping"
        },
        {
            "displayName": "Value",
            "name": "value",
            "kind": "Measure"
        }
    ],
    "drilldown": {
        "roles": [
            "category"
        ]
    },
    "dataViewMappings": [
        {
            "categorical": {
                "categories": {
                    "for": {
                        "in": "category"
                    }
                },
                "values": {
                    "select": [
                        {
                            "bind": {
                                "to": "value"
                            }
                        }
                    ]
                }
            }
        }
    ]
}
Tworzenie wizualizacji z obsługą przechodzenia do szczegółów
Aby utworzyć wizualizację z obsługą przechodzenia do szczegółów, uruchom następujące polecenie:
pbiviz new testDrillDown -t default
Aby utworzyć domyślną przykładową wizualizację, zastosuj powyższy przykładcapabilities.json do nowo utworzonej wizualizacji.
Utwórz właściwość kontenera div do przechowywania elementów HTML wizualizacji:
"use strict";

import "core-js/stable";
import "./../style/visual.less";
// imports

export class Visual implements IVisual {
    // visual properties
    // ...
    private div: HTMLDivElement; // <== NEW PROPERTY

    constructor(options: VisualConstructorOptions) {
        // constructor body
        // ...
    }

    public update(options: VisualUpdateOptions) {
        // update method body
        // ...
    }

    /**
     * Returns properties pane formatting model content hierarchies, properties and latest formatting values, Then populate properties pane.
     * This method is called once each time we open the properties pane or when the user edits any format property.
     */
    public getFormattingModel(): powerbi.visuals.FormattingModel {
        return this.formattingSettingsService.buildFormattingModel(this.formattingSettings);
    }
}
Zaktualizuj konstruktor wizualizacji:
export class Visual implements IVisual {
    // visual properties
    // ...
    private div: HTMLDivElement;

    constructor(options: VisualConstructorOptions) {
        console.log('Visual constructor', options);
        this.formattingSettingsService = new FormattingSettingsService();
        this.target = options.element;
        this.updateCount = 0;

        if (document) {
            const new_p: HTMLElement = document.createElement("p");
            new_p.appendChild(document.createTextNode("Update count:"));
            const new_em: HTMLElement = document.createElement("em");
            this.textNode = document.createTextNode(this.updateCount.toString());
            new_em.appendChild(this.textNode);
            new_p.appendChild(new_em);
            this.div = document.createElement("div"); // <== CREATE DIV ELEMENT
            this.target.appendChild(new_p);
        }
    }
}
Aby utworzyć buttonelement , zaktualizuj metodę update wizualizacji:
export class Visual implements IVisual {
    // ...

    public update(options: VisualUpdateOptions) {
        this.formattingSettings = this.formattingSettingsService.populateFormattingSettingsModel(VisualFormattingSettingsModel, options.dataViews);
        console.log('Visual update', options);

        const dataView: DataView = options.dataViews[0];
        const categoricalDataView: DataViewCategorical = dataView.categorical;

        // don't create elements if no data
        if (!options.dataViews[0].categorical ||
            !options.dataViews[0].categorical.categories) {
            return
        }

        // to display current level of hierarchy
        if (typeof this.textNode !== undefined) {
            this.textNode.textContent = categoricalDataView.categories[categoricalDataView.categories.length - 1].source.displayName.toString();
        }

        // remove old elements
        // for better performance use D3js pattern:
        // https://d3js.org/#enter-exit
        while (this.div.firstChild) {
            this.div.removeChild(this.div.firstChild);
        }

        // create buttons for each category value
        categoricalDataView.categories[categoricalDataView.categories.length - 1].values.forEach( (category: powerbi.PrimitiveValue, index: number) => {
            let button = document.createElement("button");
            button.innerText = category.toString();

            this.div.appendChild(button);
        })

    }
    // ...
Zastosuj proste style w pliku .\style\visual.less:
button {
    margin: 5px;
    min-width: 50px;
    min-height: 50px;
}
Przygotuj przykładowe dane do testowania wizualizacji:
| H1 | H2 | H3 | WARTOŚCI |
|---|---|---|---|
| A | A1 | A11 | 1 |
| A | A1 | A12 | 2 |
| A | A2 | A21 | 3 |
| A | A2 | A22 | 100 |
| A | A3 | A31 | 5 |
| A | A3 | A32 | 6 |
| B | B1 | B11 | 7 |
| B | B1 | B12 | 8 |
| B | B2 | B21 | 9 |
| B | B2 | B22 | 10 |
| B | B3 | B31 | 11 |
| B | B3 | B32 | 12 |
I utwórz hierarchię w programie Power BI Desktop:

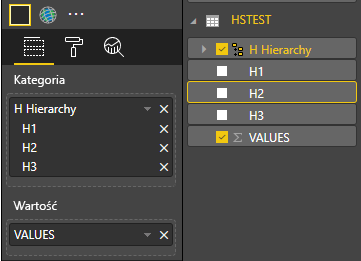
Dołącz wszystkie kolumny kategorii (H1, H2, H3) do nowej hierarchii:

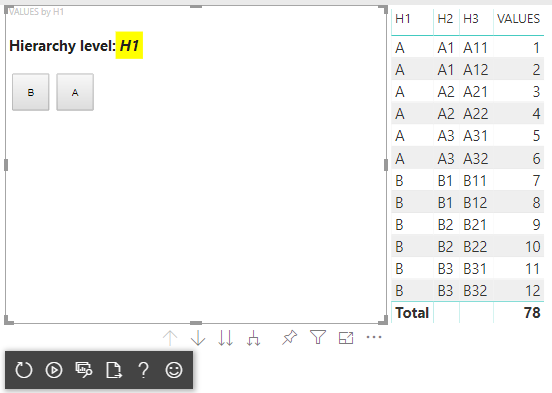
Po wykonaniu tych kroków należy uzyskać następującą wizualizację:
Dodawanie menu kontekstowego do elementów wizualizacji
Aby dodać menu kontekstowe do przycisków w wizualizacji:

Zapisz host obiekt we właściwościach wizualizacji i wywołaj createSelectionManager metodę do menedżera wyboru, aby wyświetlić menu kontekstowe przy użyciu interfejsu API wizualizacji usługi Power BI.
"use strict";

import "core-js/stable";
import "./../style/visual.less";
// default imports

import IVisualHost = powerbi.extensibility.visual.IVisualHost;
import ISelectionManager = powerbi.extensibility.ISelectionManager;
import ISelectionId = powerbi.visuals.ISelectionId;

export class Visual implements IVisual {
    // visual properties
    // ...
    private div: HTMLDivElement;
    private host: IVisualHost; // <== NEW PROPERTY
    private selectionManager: ISelectionManager; // <== NEW PROPERTY

    constructor(options: VisualConstructorOptions) {
        // constructor body
        // save the host in the visuals properties
        this.host = options.host;
        // create selection manager
        this.selectionManager = this.host.createSelectionManager();
        // ...
    }

    public update(options: VisualUpdateOptions) {
        // update method body
        // ...
    }

    // ...
}
Zmień treść wywołania zwrotnego forEach funkcji na:
    categoricalDataView.categories[categoricalDataView.categories.length - 1].values.forEach( (category: powerbi.PrimitiveValue, index: number) => {
        // create selectionID for each category value
        let selectionID: ISelectionId = this.host.createSelectionIdBuilder()
            .withCategory(categoricalDataView.categories[0], index)
            .createSelectionId();

        let button = document.createElement("button");
        button.innerText = category.toString();

        // add event listener to click event
        button.addEventListener("click", (event) => {
            // call select method in the selection manager
            this.selectionManager.select(selectionID);
        });

        button.addEventListener("contextmenu", (event) => {
            // call showContextMenu method to display context menu on the visual
            this.selectionManager.showContextMenu(selectionID, {
                x: event.clientX,
                y: event.clientY
            });
            event.preventDefault();
        });

        this.div.appendChild(button);
    });
Zastosuj dane do wizualizacji:
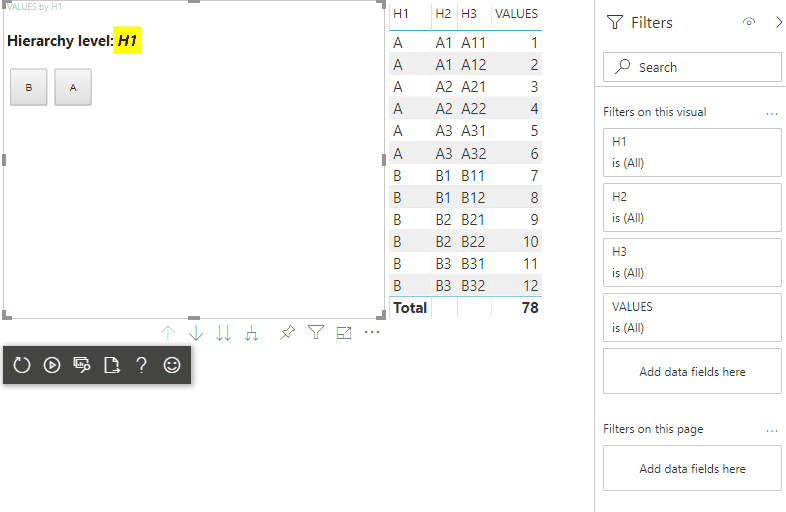
W ostatnim kroku należy uzyskać wizualizację z wyborami i menu kontekstowym:
Dodawanie obsługi przechodzenia do szczegółów dla mapowania widoku danych macierzy
Aby przetestować wizualizację przy użyciu mapowań widoku danych macierzy, najpierw przygotuj przykładowe dane:
| Wiersz 1 | Wiersz 2 | Wiersz 3 | Kolumna 1 | Kolumna 2 | Kolumna 3 | Wartości |
|---|---|---|---|---|---|---|
| R1 | R11 | R111 | C1 | C11 | C111 | 1 |
| R1 | R11 | R112 | C1 | C11 | C112 | 2 |
| R1 | R11 | R113 | C1 | C11 | C113 | 3 |
| R1 | R12 | R121 | C1 | C12 | C121 | 100 |
| R1 | R12 | R122 | C1 | C12 | C122 | 5 |
| R1 | R12 | R123 | C1 | C12 | C123 | 6 |
| R1 | R13 | R131 | C1 | C13 | C131 | 7 |
| R1 | R13 | R132 | C1 | C13 | C132 | 8 |
| R1 | R13 | R133 | C1 | C13 | C133 | 9 |
| R2 | R21 | R211 | C2 | C21 | C211 | 10 |
| R2 | R21 | R212 | C2 | C21 | C212 | 11 |
| R2 | R21 | R213 | C2 | C21 | C213 | 12 |
| R2 | R22 | R221 | C2 | C22 | C221 | 13 |
| R2 | R22 | R222 | C2 | C22 | C222 | 14 |
| R2 | R22 | R223 | C2 | C22 | C223 | 16 |
| R2 | R23 | R231 | C2 | C23 | C231 | 17 |
| R2 | R23 | R232 | C2 | C23 | C232 | 18 |
| R2 | R23 | R233 | C2 | C23 | C233 | 19 |
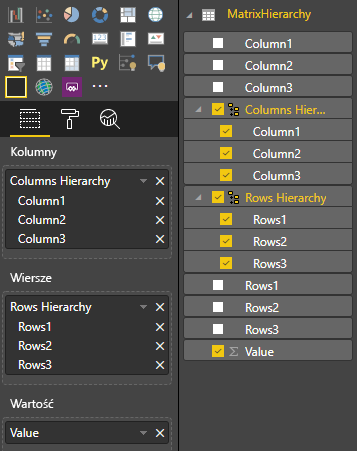
Następnie zastosuj następujące mapowanie widoku danych do wizualizacji:
{
    "dataRoles": [
        {
            "displayName": "Columns",
            "name": "columns",
            "kind": "Grouping"
        },
        {
            "displayName": "Rows",
            "name": "rows",
            "kind": "Grouping"
        },
        {
            "displayName": "Value",
            "name": "value",
            "kind": "Measure"
        }
    ],
    "drilldown": {
        "roles": [
            "columns",
            "rows"
        ]
    },
    "dataViewMappings": [
        {
            "matrix": {
                "columns": {
                    "for": {
                        "in": "columns"
                    }
                },
                "rows": {
                    "for": {
                        "in": "rows"
                    }
                },
                "values": {
                    "for": {
                        "in": "value"
                    }
                }
            }
        }
    ]
}
Zastosuj dane do wizualizacji:
Zaimportuj wymagane interfejsy do przetwarzania mapowań widoku danych macierzy:
// ...
import DataViewMatrix = powerbi.DataViewMatrix;
import DataViewMatrixNode = powerbi.DataViewMatrixNode;
import DataViewHierarchyLevel = powerbi.DataViewHierarchyLevel;
// ...
Utwórz dwie właściwości dla dwóch divwierszy i elementów kolumn:
export class Visual implements IVisual {
    // ...
    private rowsDiv: HTMLDivElement;
    private colsDiv: HTMLDivElement;
    // ...
    constructor(options: VisualConstructorOptions) {
        // constructor body
        // ...
        // Create div elements and append to main div of the visual
        this.rowsDiv = document.createElement("div");
        this.target.appendChild(this.rowsDiv);

        this.colsDiv = document.createElement("div");
        this.target.appendChild(this.colsDiv);
    }
    // ...
}
Sprawdź dane przed renderowaniem elementów i wyświetl bieżący poziom hierarchii:
export class Visual implements IVisual {
    // ...
    constructor(options: VisualConstructorOptions) {
        // constructor body
    }

    public update(options: VisualUpdateOptions) {
        this.formattingSettings = this.formattingSettingsService.populateFormattingSettingsModel(VisualFormattingSettingsModel, options.dataViews);
        console.log('Visual update', options);

        const dataView: DataView = options.dataViews[0];
        const matrixDataView: DataViewMatrix = dataView.matrix;

        // if the visual doesn't receive the data no reason to continue rendering
        if (!matrixDataView ||
            !matrixDataView.columns ||
            !matrixDataView.rows ) {
            return
        }

        // to display current level of hierarchy
        if (typeof this.textNode !== undefined) {
            this.textNode.textContent = categoricalDataView.categories[categoricalDataView.categories.length - 1].source.displayName.toString();
        }
        // ...
    }
    // ...
}
Utwórz funkcję treeWalker przechodzenia przez hierarchię:
export class Visual implements IVisual {
    // ...
    public update(options: VisualUpdateOptions) {
        // ...

        // if the visual doesn't receive the data no reason to continue rendering
        if (!matrixDataView ||
            !matrixDataView.columns ||
            !matrixDataView.rows ) {
            return
        }

        const treeWalker = (matrixNode: DataViewMatrixNode, index: number, levels: DataViewHierarchyLevel[], div: HTMLDivElement)  => {
            // ...
            if (matrixNode.children) {
                // ...
                // traversing child nodes
                matrixNode.children.forEach((node, index) => treeWalker(node, index, levels, childDiv));
            }
        }

        // traversing rows
        const rowRoot: DataViewMatrixNode = matrixDataView.rows.root;
        rowRoot.children.forEach((node, index) => treeWalker(node, index, matrixDataView.rows.levels, this.rowsDiv));

        // traversing columns
        const colRoot = matrixDataView.columns.root;
        colRoot.children.forEach((node, index) => treeWalker(node, index, matrixDataView.columns.levels, this.colsDiv));
    }
    // ...
}
Wygeneruj opcje dla punktów danych.
const treeWalker = (matrixNode: DataViewMatrixNode, index: number, levels: DataViewHierarchyLevel[], div: HTMLDivElement)  => {
    // generate selectionID for each node of matrix
    const selectionID: ISelectionID = this.host.createSelectionIdBuilder()
        .withMatrixNode(matrixNode, levels)
        .createSelectionId();
    // ...
    if (matrixNode.children) {
        // ...
        // traversing child nodes
        matrixNode.children.forEach((node, index) => treeWalker(node, index, levels, childDiv));
    }
}
Utwórz div dla każdego poziomu hierarchii:
const treeWalker = (matrixNode: DataViewMatrixNode, index: number, levels: DataViewHierarchyLevel[], div: HTMLDivElement)  => {
    // generate selectionID for each node of matrix
    const selectionID: ISelectionID = this.host.createSelectionIdBuilder()
        .withMatrixNode(matrixNode, levels)
        .createSelectionId();
    // ...
    if (matrixNode.children) {
        // create div element for level
        const childDiv = document.createElement("div");
        // add to current div
        div.appendChild(childDiv);
        // create paragraph element to display next
        const p = document.createElement("p");
        // display level name on paragraph element
        const level = levels[matrixNode.level];
        p.innerText = level.sources[level.sources.length - 1].displayName;
        // add paragraph element to created child div
        childDiv.appendChild(p);
        // traversing child nodes
        matrixNode.children.forEach((node, index) => treeWalker(node, index, levels, childDiv));
    }
}
Utwórz buttons , aby wchodzić w interakcje z wizualizacją i wyświetlać menu kontekstowe dla punktów danych macierzy:
const treeWalker = (matrixNode: DataViewMatrixNode, index: number, levels: DataViewHierarchyLevel[], div: HTMLDivElement)  => {
    // generate selectionID for each node of matrix
    const selectionID: ISelectionID = this.host.createSelectionIdBuilder()
        .withMatrixNode(matrixNode, levels)
        .createSelectionId();

    // create button element
    let button = document.createElement("button");
    // display node value/name of the button's text
    button.innerText = matrixNode.value.toString();

    // add event listener on click
    button.addEventListener("click", (event) => {
        // call select method in the selection manager
        this.selectionManager.select(selectionID);
    });

    // display context menu on click
    button.addEventListener("contextmenu", (event) => {
        // call showContextMenu method to display context menu on the visual
        this.selectionManager.showContextMenu(selectionID, {
            x: event.clientX,
            y: event.clientY
        });
        event.preventDefault();
    });

    div.appendChild(button);

    if (matrixNode.children) {
        // ...
    }
}
Wyczyść div elementy przed ponownym renderowaniem elementów:
public update(options: VisualUpdateOptions) {
    // ...
    const treeWalker = (matrixNode: DataViewMatrixNode, index: number, levels: DataViewHierarchyLevel[], div: HTMLDivElement)  => {
        // ...
    }

    // remove old elements
    // to better performance use D3js pattern:
    // https://d3js.org/#enter-exit
    while (this.rowsDiv.firstChild) {
        this.rowsDiv.removeChild(this.rowsDiv.firstChild);
    }
    // create label for row elements
    const prow = document.createElement("p");
    prow.innerText = "Rows";
    this.rowsDiv.appendChild(prow);

    while (this.colsDiv.firstChild) {
        this.colsDiv.removeChild(this.colsDiv.firstChild);
    }
    // create label for columns elements
    const pcol = document.createElement("p");
    pcol.innerText = "Columns";
    this.colsDiv.appendChild(pcol);

    // render elements for rows
    const rowRoot: DataViewMatrixNode = matrixDataView.rows.root;
    rowRoot.children.forEach((node, index) => treeWalker(node, index, matrixDataView.rows.levels, this.rowsDiv));

    // render elements for columns
    const colRoot = matrixDataView.columns.root;
    colRoot.children.forEach((node, index) => treeWalker(node, index, matrixDataView.columns.levels, this.colsDiv));
}
Na koniec należy uzyskać wizualizację z menu kontekstowym: