Nota
O acesso a esta página requer autorização. Podes tentar iniciar sessão ou mudar de diretório.
O acesso a esta página requer autorização. Podes tentar mudar de diretório.
Os dados da tabela do Excel podem ser representados como uma matriz de objetos sob a forma de JSON. Cada objeto representa uma linha na tabela. Isto ajuda a extrair os dados do Excel num formato consistente que é visível para o utilizador. Em seguida, os dados podem ser fornecidos a outros sistemas através de fluxos do Power Automate.
Configuração: ficheiro do Excel de exemplo
Este livro contém os dados, objetos e formatação esperados pelo script.
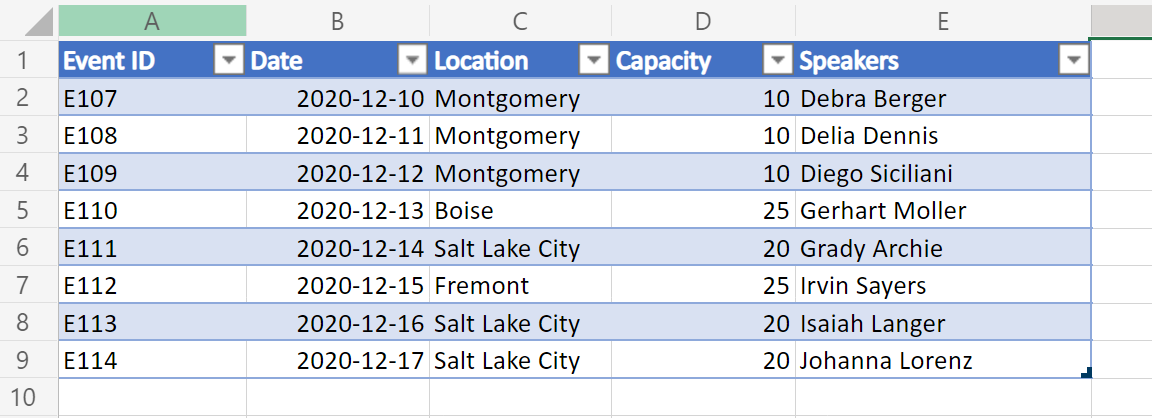
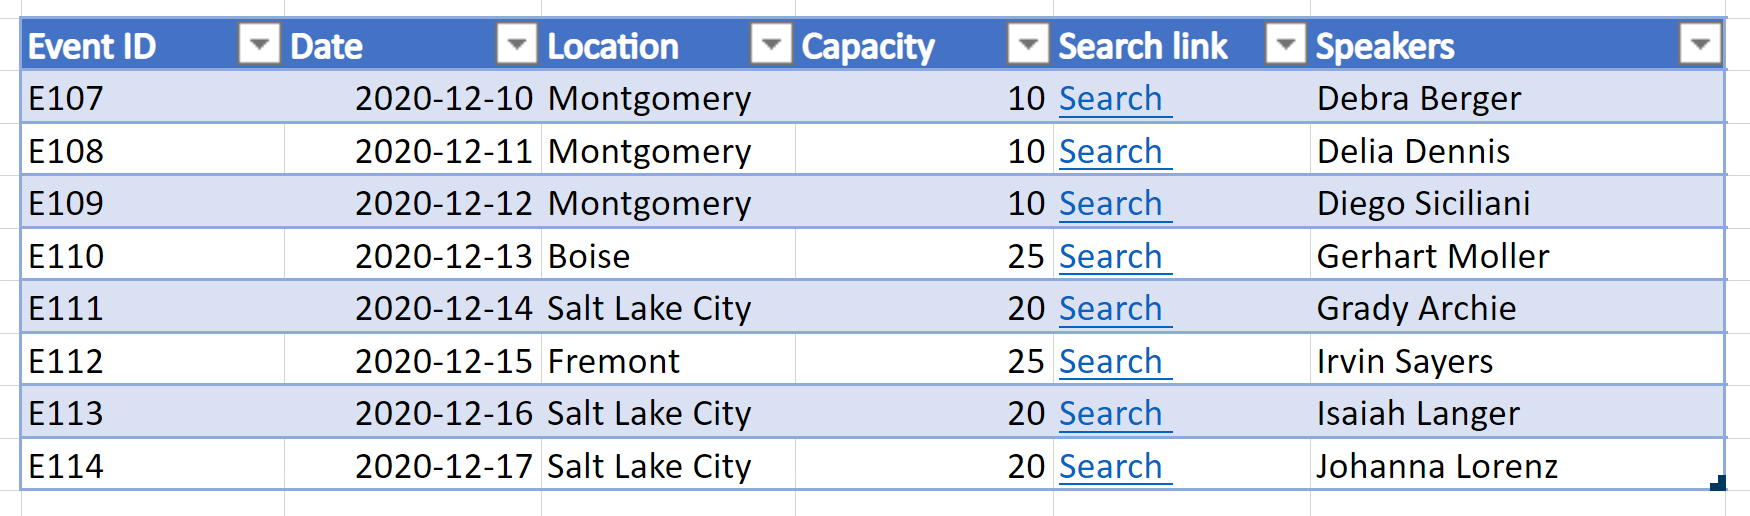
Uma variação deste exemplo também inclui as hiperligações numa das colunas da tabela. Isto permite que sejam apresentados níveis adicionais de dados de células no JSON.
Código de exemplo: devolver dados da tabela como JSON
Execute o seguinte script no livro de exemplo e experimente o exemplo! Abra o Editor de Código ao aceder a Automatizar>a Criação de Novo Script>no Editor de Código, substitua o código predefinido pelo código de exemplo que pretende executar e, em seguida, selecione Executar.
Observação
Pode alterar a interface TableData estrutura para corresponder às colunas da tabela. Tenha em atenção que, para nomes de colunas com espaços, certifique-se de que coloca a chave entre aspas, tal como no "Event ID" exemplo. Para obter mais informações sobre como trabalhar com JSON, leia Utilizar JSON para transmitir dados de e para Scripts do Office.
function main(workbook: ExcelScript.Workbook): TableData[] {
  // Get the first table in the "PlainTable" worksheet.
  // If you know the table name, use `workbook.getTable('TableName')` instead.
  const table = workbook.getWorksheet('PlainTable').getTables()[0];

  // Get all the values from the table as text.
  const texts = table.getRange().getTexts();

  // Create an array of JSON objects that match the row structure.
  let returnObjects: TableData[] = [];
  if (table.getRowCount() > 0) {
    returnObjects = returnObjectFromValues(texts);
  }

  // Log the information and return it for a Power Automate flow.
  console.log(JSON.stringify(returnObjects));
  return returnObjects
}

// This function converts a 2D array of values into a generic JSON object.
// In this case, we have defined the TableData object, but any similar interface would work.
function returnObjectFromValues(values: string[][]): TableData[] {
  let objectArray: TableData[] = [];
  let objectKeys: string[] = [];
  for (let i = 0; i < values.length; i++) {
    if (i === 0) {
      objectKeys = values[i]
      continue;
    }

    let object: {[key: string]: string} = {}
    for (let j = 0; j < values[i].length; j++) {
      object[objectKeys[j]] = values[i][j]
    }

    objectArray.push(object as unknown as TableData);
  }

  return objectArray;
}

interface TableData {
  "Event ID": string
  Date: string
  Location: string
  Capacity: string
  Speakers: string
}
Saída de exemplo da folha de cálculo "PlainTable"
[{
    "Event ID": "E107",
    "Date": "2020-12-10",
    "Location": "Montgomery",
    "Capacity": "10",
    "Speakers": "Debra Berger"
}, {
    "Event ID": "E108",
    "Date": "2020-12-11",
    "Location": "Montgomery",
    "Capacity": "10",
    "Speakers": "Delia Dennis"
}, {
    "Event ID": "E109",
    "Date": "2020-12-12",
    "Location": "Montgomery",
    "Capacity": "10",
    "Speakers": "Diego Siciliani"
}, {
    "Event ID": "E110",
    "Date": "2020-12-13",
    "Location": "Boise",
    "Capacity": "25",
    "Speakers": "Gerhart Moller"
}, {
    "Event ID": "E111",
    "Date": "2020-12-14",
    "Location": "Salt Lake City",
    "Capacity": "20",
    "Speakers": "Grady Archie"
}, {
    "Event ID": "E112",
    "Date": "2020-12-15",
    "Location": "Fremont",
    "Capacity": "25",
    "Speakers": "Irvin Sayers"
}, {
    "Event ID": "E113",
    "Date": "2020-12-16",
    "Location": "Salt Lake City",
    "Capacity": "20",
    "Speakers": "Isaiah Langer"
}, {
    "Event ID": "E114",
    "Date": "2020-12-17",
    "Location": "Salt Lake City",
    "Capacity": "20",
    "Speakers": "Johanna Lorenz"
}]
Código de exemplo: devolver dados da tabela como JSON com texto de hiperligação
Observação
O script extrai sempre hiperligações da 4.ª coluna (índice 0) da tabela. Pode alterar essa ordem ou incluir múltiplas colunas como dados de hiperligação ao modificar o código no comentário // For the 4th column (0 index), extract the hyperlink and use that instead of text.
function main(workbook: ExcelScript.Workbook): TableData[] {
  // Get the first table in the "WithHyperLink" worksheet.
  // If you know the table name, use `workbook.getTable('TableName')` instead.
  const table = workbook.getWorksheet('WithHyperLink').getTables()[0];

  // Get all the values from the table as text.
  const range = table.getRange();

  // Create an array of JSON objects that match the row structure.
  let returnObjects: TableData[] = [];
  if (table.getRowCount() > 0) {
    returnObjects = returnObjectFromValues(range);
  }

  // Log the information and return it for a Power Automate flow.
  console.log(JSON.stringify(returnObjects));
  return returnObjects
}

function returnObjectFromValues(range: ExcelScript.Range): TableData[] {
  let values = range.getTexts();
  let objectArray : TableData[] = [];
  let objectKeys: string[] = [];
  for (let i = 0; i < values.length; i++) {
    if (i === 0) {
      objectKeys = values[i]
      continue;
    }

    let object = {}
    for (let j = 0; j < values[i].length; j++) {
      // For the 4th column (0 index), extract the hyperlink and use that instead of text.
      if (j === 4) {
        object[objectKeys[j]] = range.getCell(i, j).getHyperlink().address;
      } else {
        object[objectKeys[j]] = values[i][j];
      }
    }

    objectArray.push(object as TableData);
  }
  return objectArray;
}

interface TableData {
  "Event ID": string
  Date: string
  Location: string
  Capacity: string
  "Search link": string
  Speakers: string
}
Resultado de exemplo da folha de cálculo "WithHyperLink"
[{
    "Event ID": "E107",
    "Date": "2020-12-10",
    "Location": "Montgomery",
    "Capacity": "10",
    "Search link": "https://www.google.com/search?q=Montgomery",
    "Speakers": "Debra Berger"
}, {
    "Event ID": "E108",
    "Date": "2020-12-11",
    "Location": "Montgomery",
    "Capacity": "10",
    "Search link": "https://www.google.com/search?q=Montgomery",
    "Speakers": "Delia Dennis"
}, {
    "Event ID": "E109",
    "Date": "2020-12-12",
    "Location": "Montgomery",
    "Capacity": "10",
    "Search link": "https://www.google.com/search?q=Montgomery",
    "Speakers": "Diego Siciliani"
}, {
    "Event ID": "E110",
    "Date": "2020-12-13",
    "Location": "Boise",
    "Capacity": "25",
    "Search link": "https://www.google.com/search?q=Boise",
    "Speakers": "Gerhart Moller"
}, {
    "Event ID": "E111",
    "Date": "2020-12-14",
    "Location": "Salt Lake City",
    "Capacity": "20",
    "Search link": "https://www.google.com/search?q=salt+lake+city",
    "Speakers": "Grady Archie"
}, {
    "Event ID": "E112",
    "Date": "2020-12-15",
    "Location": "Fremont",
    "Capacity": "25",
    "Search link": "https://www.google.com/search?q=Fremont",
    "Speakers": "Irvin Sayers"
}, {
    "Event ID": "E113",
    "Date": "2020-12-16",
    "Location": "Salt Lake City",
    "Capacity": "20",
    "Search link": "https://www.google.com/search?q=salt+lake+city",
    "Speakers": "Isaiah Langer"
}, {
    "Event ID": "E114",
    "Date": "2020-12-17",
    "Location": "Salt Lake City",
    "Capacity": "20",
    "Search link": "https://www.google.com/search?q=salt+lake+city",
    "Speakers": "Johanna Lorenz"
}]
Utilizar no Power Automate
Para saber como utilizar este script no Power Automate, veja Criar um fluxo de trabalho automatizado com o Power Automate.
Colabore connosco no GitHub
A fonte deste conteúdo pode ser encontrada no GitHub, onde também pode criar e rever issues e pull requests. Para mais informações, consulte o nosso guia para colaboradores.