PowerShell SCOM monitor using too much resources

njadric 116 Reputation points
2021-06-28T14:45:02.043+00:00

Hi all, I hope you could help me.

I have built custom IIS Web Site and IIS App Pool availability monitors to replace the original ones. The reason is that the original do not have an option to alert only after certain period of object being down, and we have a lot of IIS restarts that cause alerts.

I have used Kevin Holman's fragments in Visual studio and the whole thing have two, pretty much the same, PowerShell script based monitors. One for App Pools and one for Web Sites. At the beginning I haven't build with cookdown and I though that was the reason. Once implemented, the cookdown has reduced resource usage a lot, but I still get a lot of strain on agents.
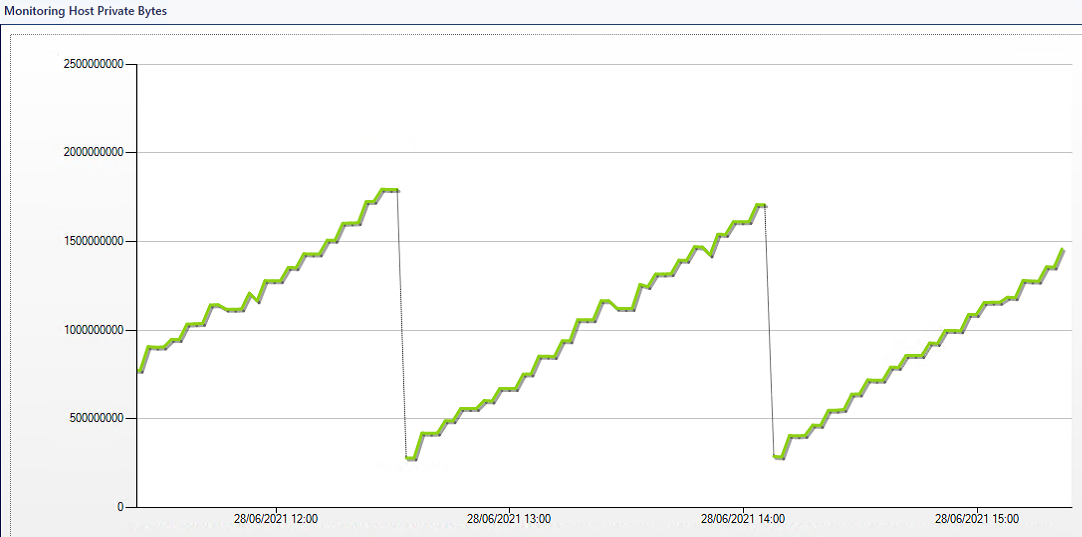
For example, all my agents on IIS web servers are restarting all the time, and Monitoring host private bytes are looking like this:

109878-mon-host-priv-bytes.png

If I disable one of these monitors, I will get slightly less impact on performance, but only after disabling both, it will come back to normal.

The scripts are very simple. I am including only logic part, not the whole script.

App Pool Availability Monitor

# Begin MAIN script section  
#=================================================================================  
  
$strCondition = Get-WebAppPoolState  
  
foreach ($strCond in $strCondition) {  
  
    $bag = $momapi.CreatePropertyBag()  
    $PoolID = $strCond.ItemXPath.split("'")[1]  
    $AppPoolStatus = $strCond.Value  
    $bag.AddValue('PoolID',$PoolID)  
  
    #Check the value of $strCond  
    IF ($AppPoolStatus -eq 'Started') {  
    $momapi.LogScriptEvent($ScriptName,$EventID,0,'Good Condition Found')  
    $bag.AddValue('Result','Running')  
    } else {  
    $momapi.LogScriptEvent($ScriptName,$EventID,0,'Bad Condition Found')  
    $bag.AddValue('Result','NotRunning')  
    }  
  
    $bag  
}  
  
# End of script section  

Web Site Availability Monitor

# Begin MAIN script section  
#=================================================================================  
  
$strCondition = Get-WebSiteState  
  
foreach ($strCond in $strCondition) {  
  
    $bag = $momapi.CreatePropertyBag()  
    $DisplayName = $strCond.ItemXPath.split("'")[1]  
    $WebSiteStatus = $strCond.Value  
    $bag.AddValue('DisplayName',$DisplayName)  
  
    #Check the value of $strCond  
    IF ($WebSiteStatus -eq 'Started') {  
    $momapi.LogScriptEvent($ScriptName,$EventID,0,'Good Condition Found')  
    $bag.AddValue('Result','Running')  
    } else {  
    $momapi.LogScriptEvent($ScriptName,$EventID,0,'Bad Condition Found')  
    $bag.AddValue('Result','NotRunning')  
    }  
  
    $bag  
}  
  
# End of script section  

I am wondering why is this using so much resources and is there a way for me to pinpoint where it happens?

I have also tried to override an agent and add bigger values to Private Bytes and Handle Count, but it just kept on rising until agent restarted.

Also, if there are alternatives that solve initial problem, an other way to get Web Site and App Pool availability monitor that you can control in terms of alert suppression.

Thanks!
Niksa

System Center Operations Manager
A family of System Center products that provide infrastructure monitoring, help ensure the predictable performance and availability of vital applications, and offer comprehensive monitoring for datacenters and cloud, both private and public.
0 comments No comments
{count} votes

Answer accepted by question author
  1. njadric 116 Reputation points
    2021-07-06T15:45:29.157+00:00

    Okay, I have found a solution, or rather a workaround.

    Instead of using IIS Webadministration PS module cmdlets, I have found alternative ways to get IIS App Pool and IIS Web Site status data.

    This is how my PowerShell part looks like in each:

    App Pool Availability Monitor

    # Begin MAIN script section
    #=================================================================================
    
    
    $counters = Get-Counter -Counter "\APP_POOL_WAS(*)\Current Application Pool State"
    $strCondition = $counters.countersamples | where InstanceName -ne "_total"
    
    foreach ($strCond in $strCondition) {
    
        $bag = $momapi.CreatePropertyBag()
        $PoolID = $strCond.InstanceName
        $AppPoolStatus = $strCond.RawValue
        $bag.AddValue('PoolID',$PoolID)
    
        #Check the value of $strCond
        IF ($AppPoolStatus -eq '3') {
            $momapi.LogScriptEvent($ScriptName,$EventID,0,'Good Condition Found')
            $bag.AddValue('Result','Running')
        } else {
            $momapi.LogScriptEvent($ScriptName,$EventID,0,'Bad Condition Found')
            $bag.AddValue('Result','NotRunning')
        }
    
        $bag
    }                                   
    
    
    # End of script section
    

    Web Site Availability Monitor

    # Begin MAIN script section
    #=================================================================================
    
    
    $strCondition = Invoke-Expression "$env:SystemRoot\system32\inetsrv\AppCmd.exe list site"
    
    foreach ($strCond in $strCondition) {
    
        $bag = $momapi.CreatePropertyBag()
        $DisplayName = $strCond.Split('"')[1]
        $WebSiteStatus = $strCond.Split(':')[-1]
        $bag.AddValue('DisplayName',$DisplayName)
    
        #Check the value of $strCond
        IF ($WebSiteStatus -eq 'Started)') {     # Started) is okay because that's the result of splitting the string
            $momapi.LogScriptEvent($ScriptName,$EventID,0,'Good Condition Found')
            $bag.AddValue('Result','Running')
        } else {
            $momapi.LogScriptEvent($ScriptName,$EventID,0,'Bad Condition Found')
            $bag.AddValue('Result','NotRunning')
        }
    
        $bag
    }
    
    
    # End of script section
    

    I still don't understand why those two cmdlets are causing so much overhead, hopefully I will find out one day.


5 additional answers

Sort by: Most helpful
  1. CyrAz 5,181 Reputation points
    2021-06-29T18:49:34.12+00:00

    I would have set SyncTime instead of removing it just to make sure cookdown would always happen, but that doesn't seem to be the cause of your issue anyway.

    Unfortunately I'm not great at debugging memory dumps either, I usually just tinker around until I find something relevant - or pass it to a colleague who can handle that better than I can.

    I wouldn't say exactly that these commands are "leaking", however it does look like the variables are somehow never cleared up.
    Could you try adding Remove-Variable $strCondition at the end of your script?
    Also you can have a look at this article : https://getblogpost.pendlenet.co.uk/garbage-collection-in-powershell-scripts-in-scom/

    I must add that I absolutely never preoccupied with manually cleaning the variables or handling garbage collection in my powershell workflows, and never faced that kind of issue either... Neither did I ever saw any other MP doing it.

    0 comments No comments

Your answer

Answers can be marked as 'Accepted' by the question author and 'Recommended' by moderators, which helps users know the answer solved the author's problem.