Note
Access to this page requires authorization. You can try signing in or changing directories.
Access to this page requires authorization. You can try changing directories.
As a supervisor or administrator, you can monitor the performance of the Sales Qualification Agent and the leads it handles to verify its effectiveness. The supervisor workspace includes a dashboard that provides insights into the agent's performance, including the percentage of leads handled by the agent, revenue generated from these leads, and customer engagement effectiveness.
View the supervisor dashboard
In the Sales Hub app, go to App settings.
Under General settings, select Dynamics 365 AI hub. If you have trouble finding or accessing the AI hub, it might be due to permission restrictions. Learn more in Access Dynamics 365 AI Hub
In the AI optimization hub card, select See insights.
The Agent insights page opens with the available insights for the agents configured in your organization.Verify the Last refreshed date and time to ensure the data is up-to-date. The data is refreshed when you open the dashboard. If needed, you can refresh the dashboard by selecting the Refresh icon.
Select the Time period for which you want to view the data and select Apply filter. By default, the dashboard shows data for the last 7 days.
To view the list of leads handled by the agent, select the View leads category drop-down, and then choose any of the following options:
Note
- If you don't see the views mentioned in this section, contact your admin to add agent-specific views to your app.
- Though these views are meant for supervisors, they are also available to sellers unless your admin has set the
EnableRoleBasedSystemViewssetting to true. However, sellers can only view leads that they have access to, based on their security roles and permissions. Learn more about changing the setting in Environment database settings.
Leads disqualified by AI agent: Opens the Leads disqualified by AI agent view that lists leads that were disqualified by the agent during the selected time period. Open a lead to view the details of the disqualification on the Lead insights page. If you think the lead is worth pursuing, select Reassign to assign the lead to a seller for follow-up and qualification.
Leads being processed by AI agent: Opens the Leads being processed by AI agent view that lists all leads that the agent is currently processing. This includes leads that are being researched and leads that are being engaged with (research and engage mode only). In the research and engage mode, leads might stay in the "In process" state for a longer time if the agent is waiting for a response from the lead.
Leads handed over by AI agent: Opens the Leads handed over by AI agent view that lists all leads that were handed over to sellers for followup and qualification during the selected time period. Leads stay in this view even after they are qualified or disqualified by the seller.
Depending on the agent mode, you may see different metrics and insights in the dashboard:
View metrics related to research-only mode
If your admin has configured the Sales Qualification Agent to run in research-only mode, you can view the agent's effectiveness in researching leads, generating outreach emails, disqualifying low fit leads, and handing over promising leads to sellers. In this mode, the agent doesn't send outreach emails to leads or engage with leads.
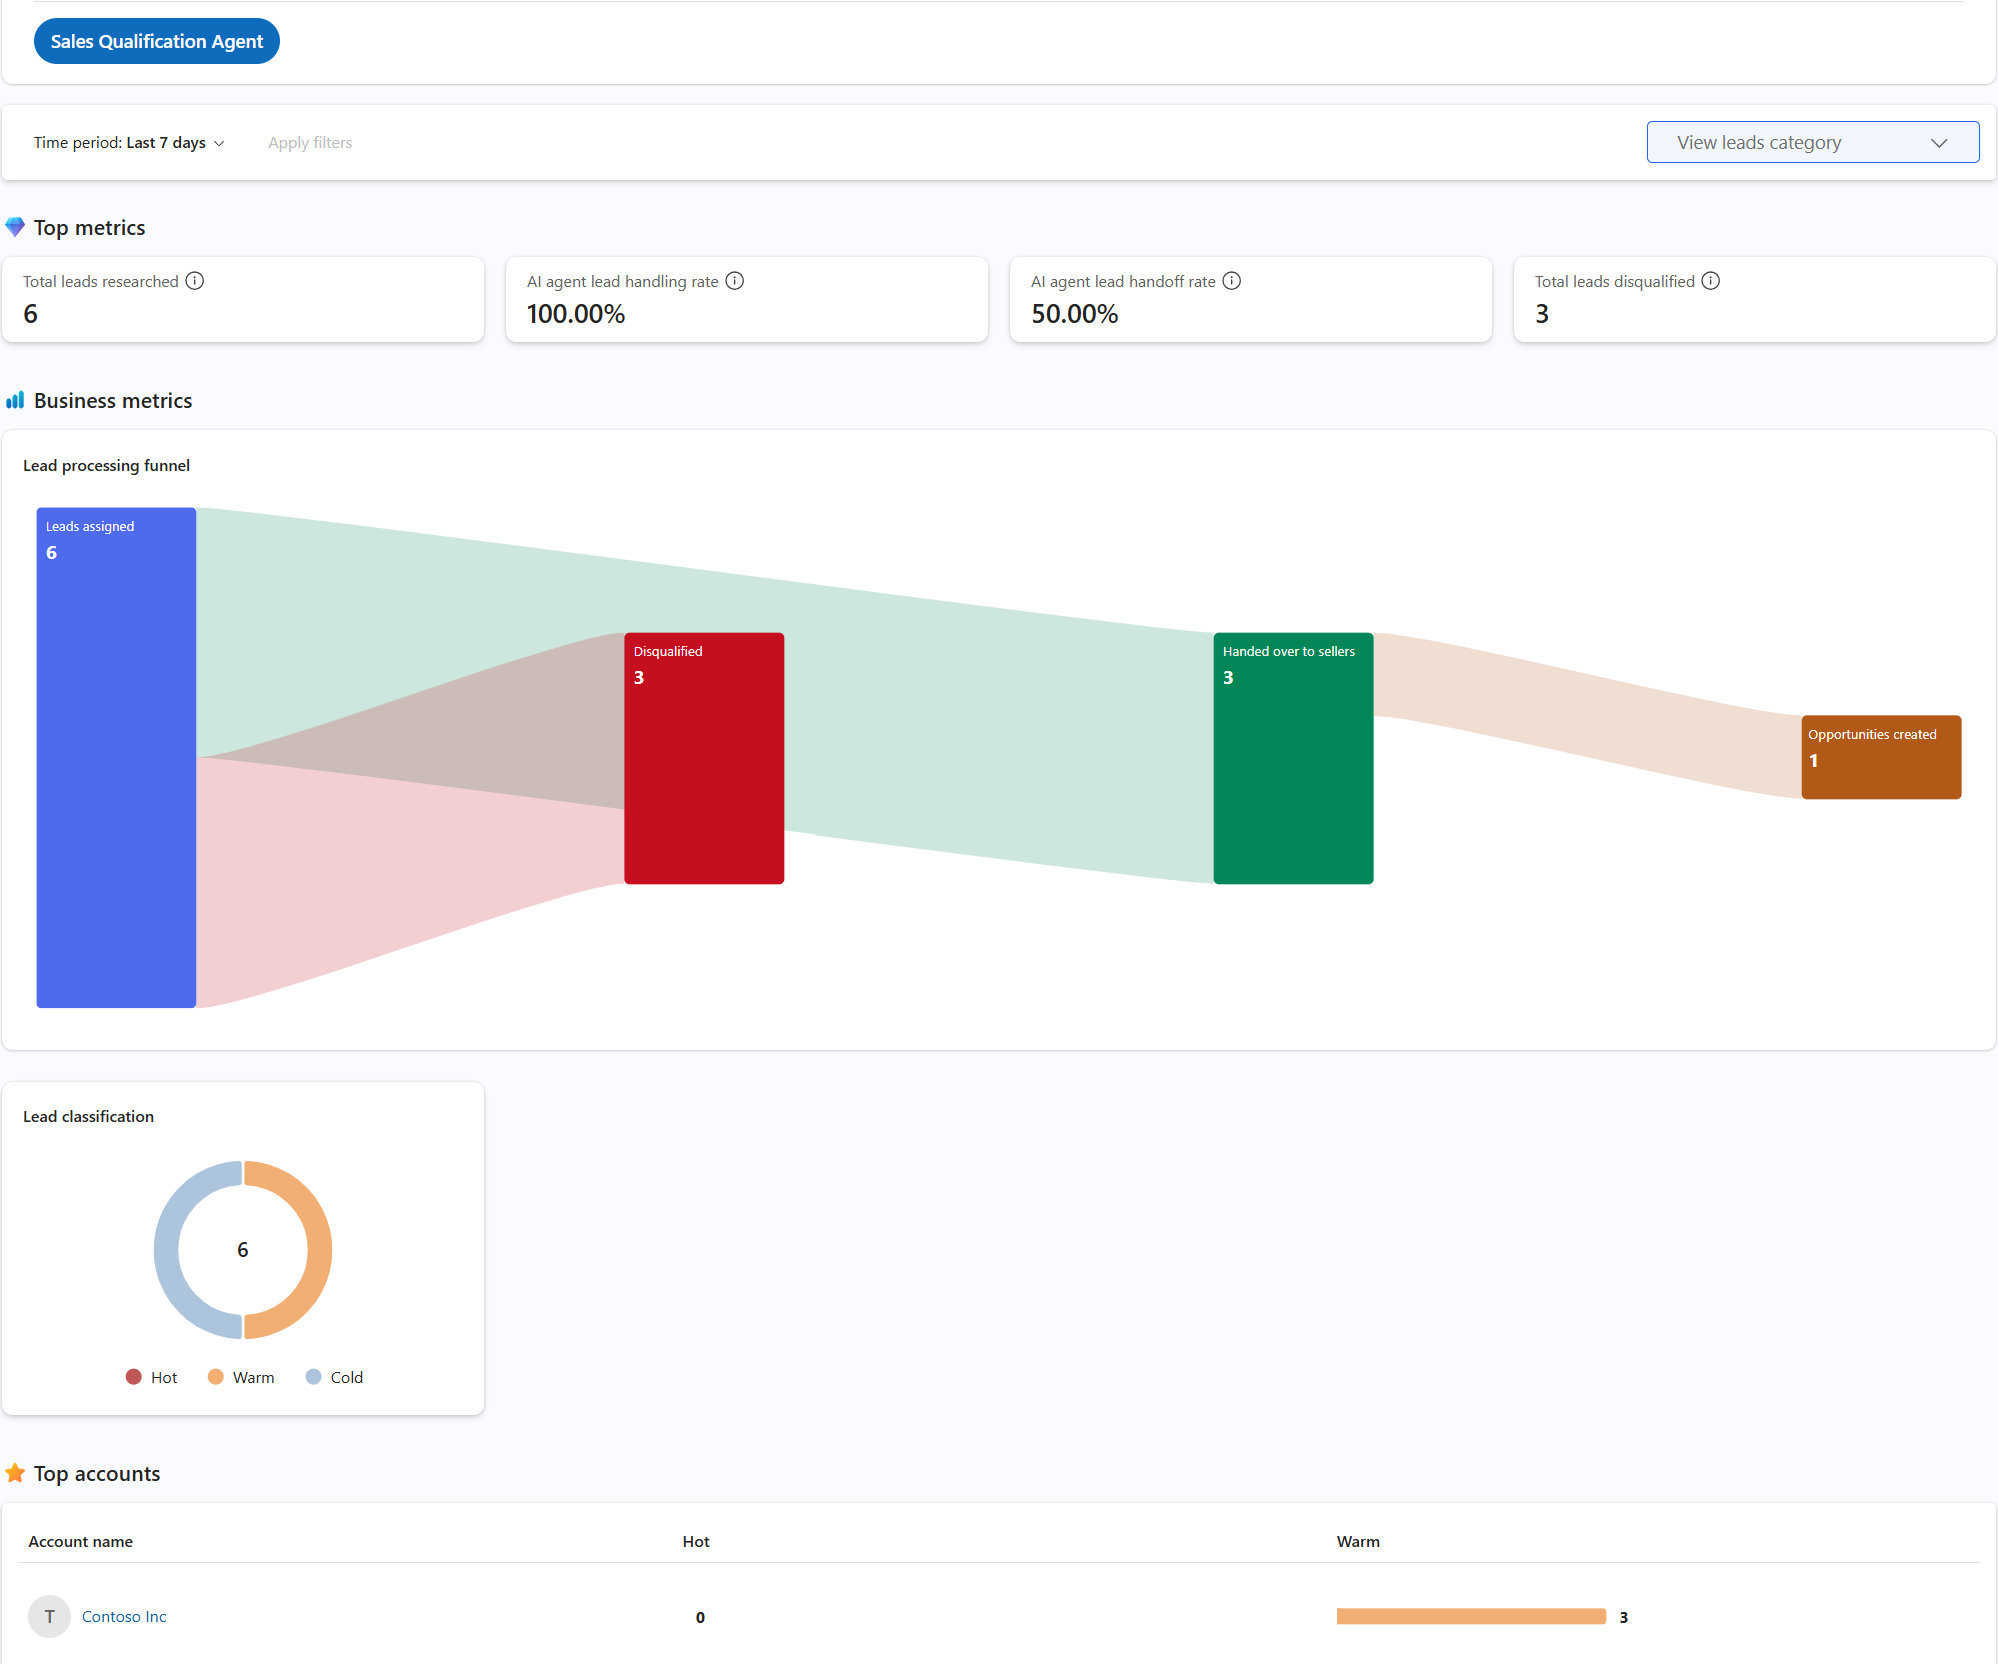
Top metrics: The following table shows the key performance metrics:
Metric Description Formula Total leads researched The total number of leads researched by the agent. Count of leads for which research is completed by the agent. AI agent lead handling rate The percentage of leads the agent could confidently process on its own, either by handing over promising leads to sellers or disqualifying them due to low fit, compared to the total number of leads processed by the agent. (Leads handed over to sellers + Leads disqualified due to low fit) ÷ Total leads processed by agent × 100 AI agent lead handoff rate The percentage of leads that were handed over to the sellers, compared to the total number of leads processed by the agent. Leads handed over to sellers ÷ Total leads processed by agent × 100 Total leads disqualified The total number of leads disqualified by the agent due to low fit. Count of leads disqualified by the agent. Business metrics: Displays the following chart and metrics:
Lead processing funnel: This funnel chart includes the number of leads at each stage of the lead processing funnel, including the total number of leads assigned to the agent, leads in progress, disqualified, failed, and handed over to the sellers. Hover over the funnel chart to view the flow and the number of leads at each stage. This chart includes the following categories:
Stage Description Leads assigned Leads assigned to the agent for processing. In progress Leads currently being processed for research and outreach email generation. Disqualified Leads disqualified by the agent due to low fit. Disqualified leads that are reassigned by a supervisor are included in Handed over to sellers. Failed Leads that failed to engage with the agent or were not successfully processed. Handed over to sellers Leads handed over to sellers by the agent, including disqualified leads reassigned by the supervisor. Opportunities created Leads that were handed over by the agent and converted into opportunities.
Lead classification: Displays the number of leads handled by the agent in each rating category, such as Hot, Warm, and Cold.
Top accounts: Displays the accounts with the highest number of leads handled by the agent during the selected time period.
View metrics related to engage mode
If your admin has configured the Sales Qualification Agent to run in research and engage mode, you can view the agent's effectiveness in researching leads, engaging with leads, disqualifying low fit leads, and handing over promising leads to sellers. In this mode, the agent autonomously sends outreach emails to leads and engages with them based on their responses.
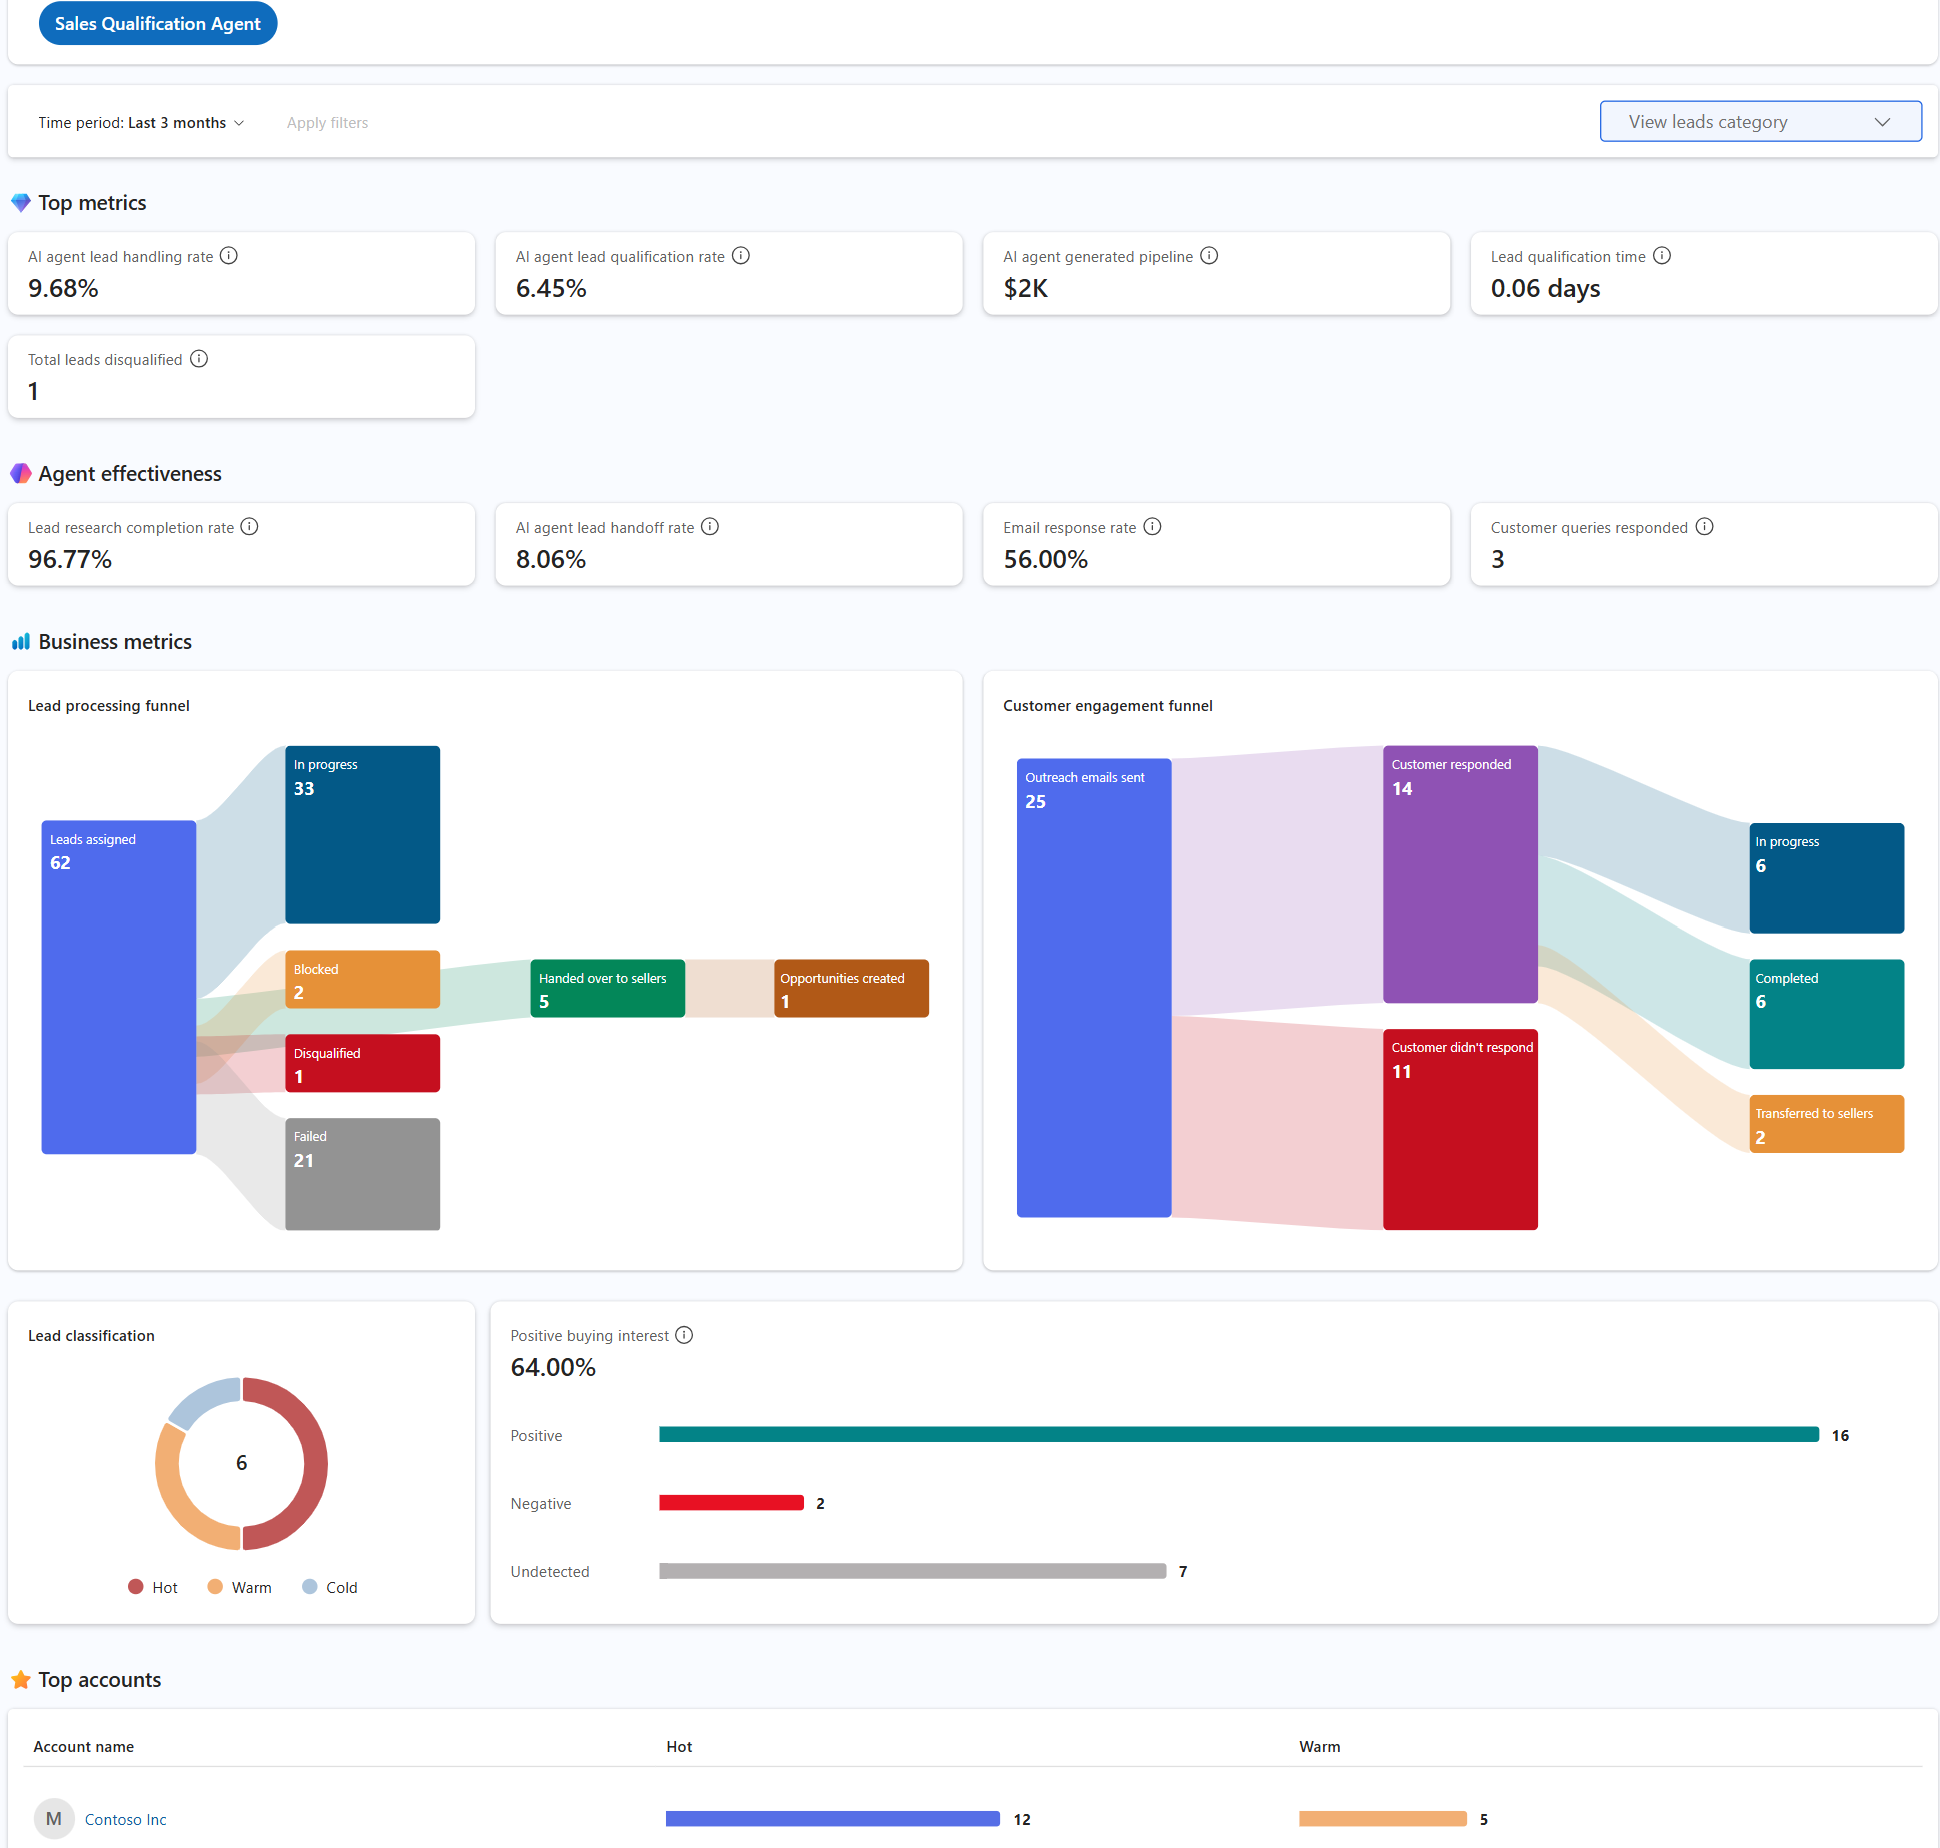
Top metrics: The following table shows the key performance metrics:
Metric Description Formula AI agent lead handling rate The percentage of leads the agent could confidently process on its own, either by handing them over with positive intent or disqualifying them due to low interest, compared to the total number of leads processed by the agent. (Leads handed over with positive intent + Leads disqualified due to low interest) ÷ Total leads processed by agent × 100 AI agent lead qualification rate The percentage of leads that were converted into customers by the agent, compared to the total number of leads processed by the agent. Leads converted to customers ÷ Total leads processed by agent × 100 AI agent generated pipeline The total revenue from opportunities generated from leads that were handed over by the agent. Sum of estimated revenue from all opportunities created from leads handed over by agent Lead qualification time The average time taken by the agent to research, engage, and qualify leads before handing them over to sellers. Average time taken from lead research to lead handoff by agent Total leads disqualified The total number of leads that were disqualified by the agent during the selected time period. Count of leads disqualified by agent Agent effectiveness: The following table shows the agent effectiveness metrics:
KPI Description Formula Lead research completion rate The percentage of leads for which the agent completed the research, compared to the total number of leads assigned to the agent. Leads with completed research ÷ Total leads assigned to agent × 100 AI agent lead handoff rate The percentage of leads that were handed over to the seller with positive buying intent, compared to the total number of leads processed by the agent. Leads handed over with positive buying intent ÷ Total leads processed by agent × 100 Email response rate The percentage of leads that responded to the outreach email sent by the agent, compared to the total number of outreach emails sent by the agent. Leads that responded to outreach emails ÷ Total outreach emails sent by agent × 100 Customer queries responded The number of customer queries that the agent responded to during the selected time period. Count of customer queries responded by agent Business metrics: Displays the following charts and metrics:
- Lead processing funnel: This funnel chart includes the number of leads at each stage of the lead processing funnel. The following table describes the categories in the funnel chart:
Stage Description Leads assigned Leads assigned to the agent for processing. In progress Leads currently being processed for research and outreach email generation. Blocked Leads that the agent couldn't autonomously process due to an open question that the agent couldn't answer. These leads are assigned to the seller who owned the lead. Disqualified Leads disqualified by the agent due to low fit. Disqualified leads that are reassigned by a supervisor are included in Handed over to sellers. Failed Leads that failed to engage with the agent or were not successfully processed. Handed over to sellers Leads handed over to sellers by the agent, including disqualified leads reassigned by the supervisor. Opportunities created Leads that were handed over by the agent and converted into opportunities. - Customer engagement funnel: This funnel chart includes the number of leads at each stage of the customer engagement funnel, including the total number of outreach emails sent, customer responses received, and no response received. The customer responses are further divided into the following categories:
Stage Description In progress Includes leads that the agent is currently engaging with. Autonomous engagements Includes leads that the agent has completed the engagement with, either by disqualifying them or handing them over to the seller with a positive buying intent. Completed Includes leads where the engagement has been completed, and the lead has either been disqualified or handed over to the seller. Transferred to sellers Includes leads that are handed over to the seller for follow-up and clarification. This number doesn't include leads that were handed over with positive intent. Interrupted due to error Includes leads that the agent couldn't hand over to the seller due to technical issues or other reasons. These leads are assigned to the seller who owned the lead. Lead classification: Displays the number of leads processed by the agent in each rating category, such as Hot, Warm, and Cold. This includes leads that were handed over to sellers and leads that were disqualified by the agent.
Positive buying interest: The percentage of leads that were handed over to the seller with positive buying interest, compared to the total number of leads processed by the agent. You can also see the number of leads with positive, negative, and undetected intent. This metric is calculated as Leads handed over with positive buying interest ÷ Total leads processed by agent × 100.
Top accounts: Displays the accounts with the highest number of leads handled by the agent during the selected time period.