Note
Access to this page requires authorization. You can try signing in or changing directories.
Access to this page requires authorization. You can try changing directories.
Note
This feature is currently in public preview. This preview is provided without a service-level agreement, and isn't recommended for production workloads. Certain features might not be supported or might have constrained capabilities. For more information, see Supplemental Terms of Use for Microsoft Azure Previews.
In this quickstart, you learn how to create a graph model in Microsoft Fabric.
Important
This article exclusively uses the AdventureWorks example graph dataset.
Prerequisites
To get started with graph in Microsoft Fabric, you need the following prerequisites:
Graph is available in your region.
Graph is enabled in your Fabric tenant:

A lakehouse in OneLake with data that you want to analyze. This quickstart uses Adventure Works data as an example. Your data and results might differ. If you don't have a lakehouse, create one by following these steps, ensuring you deselect the lakehouse schema option: Create a lakehouse with OneLake.
Important
You can't currently use a lakehouse that has lakehouse schema (preview) enabled.
You're a member of a workspace or have permission to create items in the workspace. For more information, see Workspaces in Microsoft Fabric.
Important
Access management of the graph is restricted to the workspace that hosts it. The graph isn't accessible to users outside of the workspace. Users within the workspace who have access to the underlying data in the lakehouse can model and query the graph.

Create a graph model
Graph in Microsoft Fabric uses the same workspace roles as other Microsoft Fabric items. The following table summarizes the permissions associated with each Microsoft Fabric workspace role's capability on graph models.
| Capability | Admin | Member | Contributor | Viewer |
|---|---|---|---|---|
| Create or modify graph model | ✔ | ✔ | ✔ | ✖ |
| Delete graph model | ✔ | ✔ | ✔ | ✖ |
| View and read content of graph model | ✔ | ✔ | ✔ | ✔ |
| Share graph model | ✔ | ✔ | ✖ | ✖ |
To create a graph model in Microsoft Fabric, follow these steps:
Go to your Microsoft Fabric workspace.
Select + New item.
Select Analyze and train data > Graph model (preview).

Tip
Alternatively, enter "graph" in the search box and press Enter to search for graph items.
Enter a name for your graph model and select Create.

Create a graph
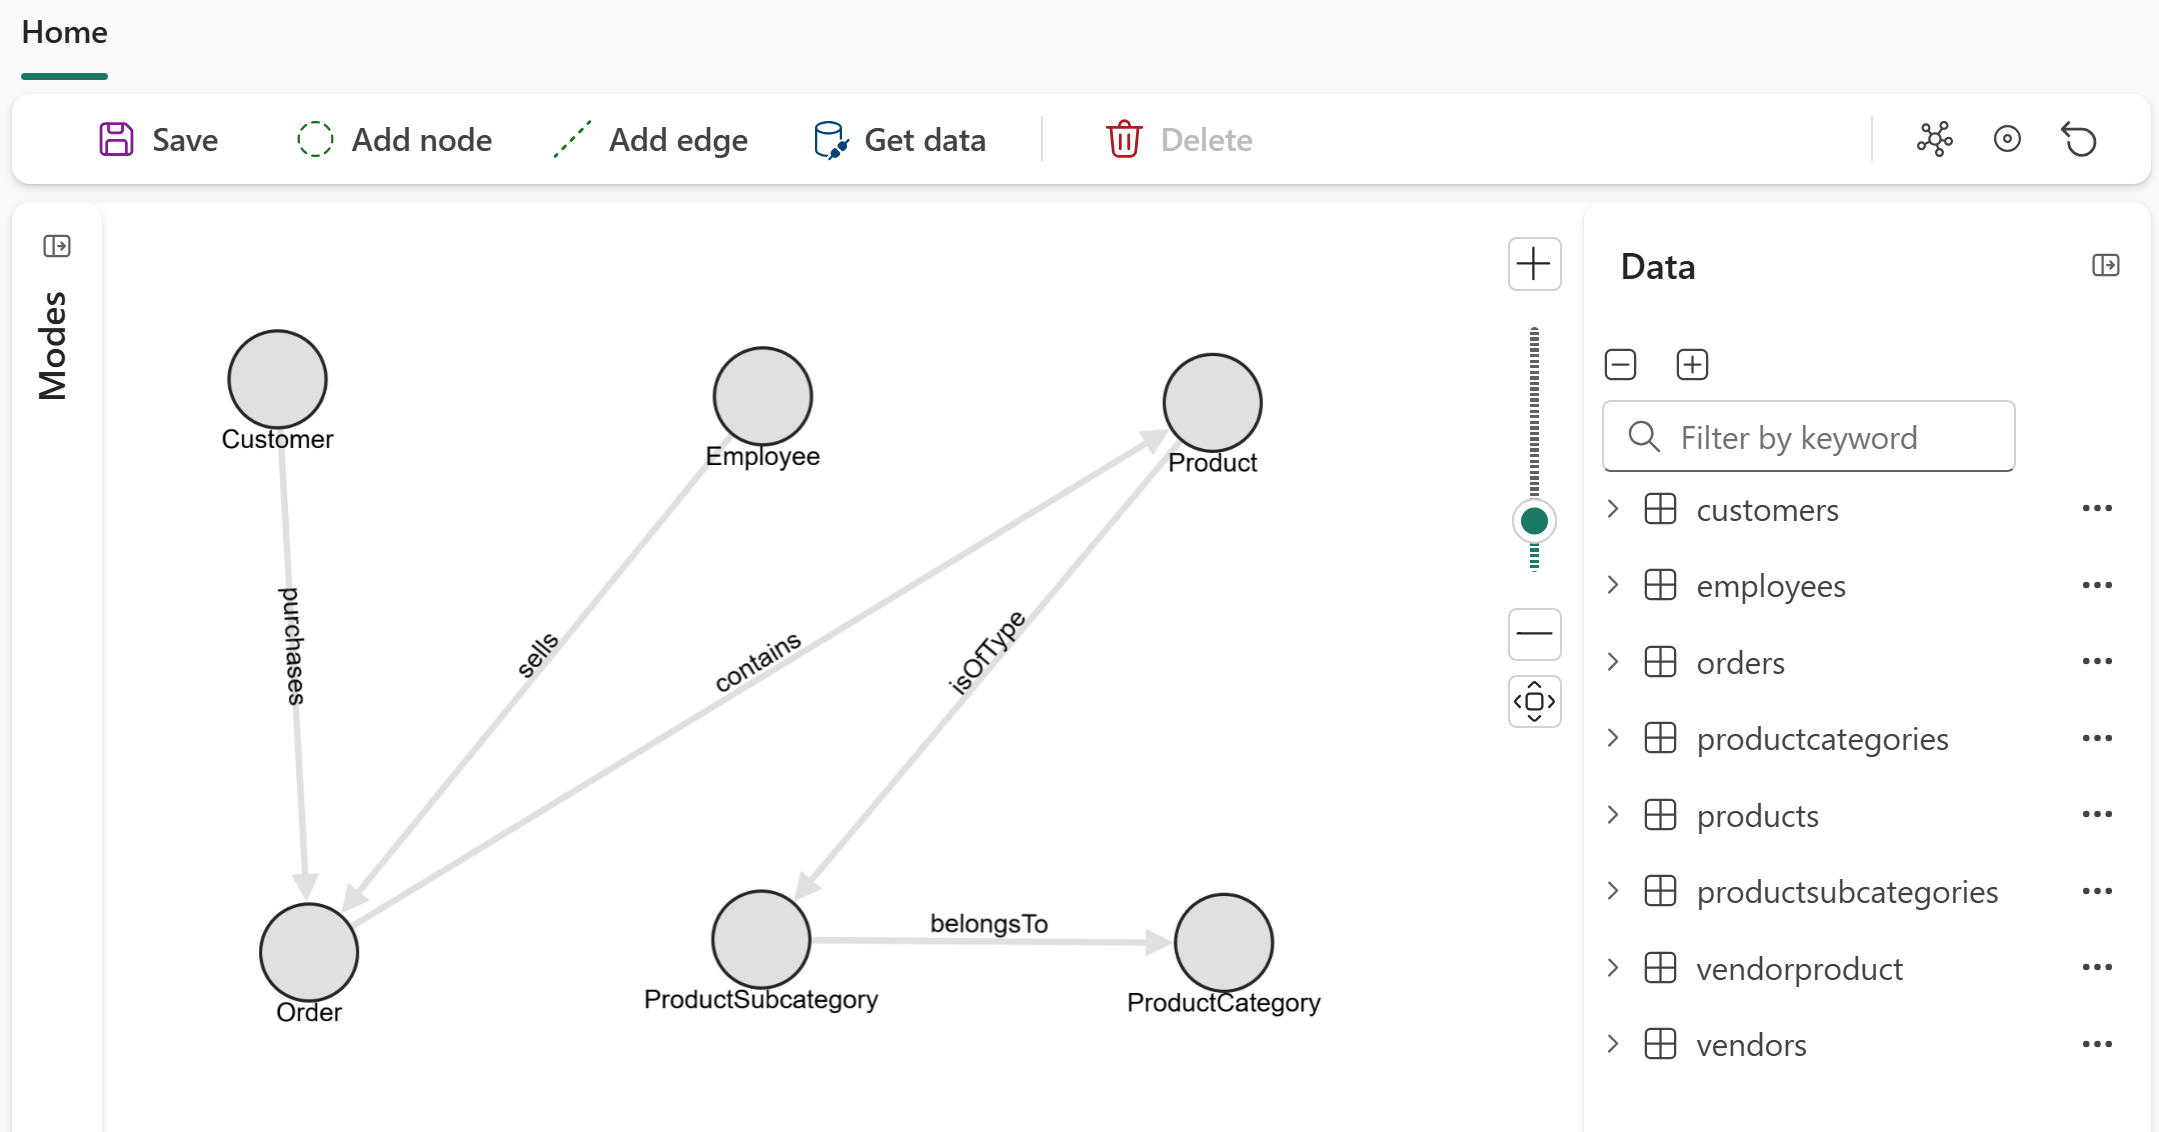
In graph view, you should see Save, Add node, and Add edge, and Get data buttons.
To create a graph in Microsoft Fabric, follow these steps:
In your graph model, select Get data.
From the OneLake catalog, select data from Fabric to use in your graph.

Note
This quickstart uses Adventure Works data as an example. Your data set and results might differ.
Then select Connect.
Select data tables and then select Load.
You should see data available for use in your graph.

Note
Graph in Microsoft Fabric currently supports the following data types:
- Boolean (values are
trueandfalse) - Double (values are 64-bit floating point numbers)
- Integer (values are 64-bit signed integers)
- String (values are Unicode character strings)
- Zoned DateTime (values are timestamps together with a timeshift for the time zone)
- Boolean (values are


Start modeling
Now you can start modeling by adding nodes and edges to the graph. We use the Adventure Works data model as an example.
Add nodes
In this section, we create nodes for each entity in the Adventure Works data model.
| Node label | Mapping table | Mapping column |
|---|---|---|
| Customer | customers | CustomerID_K |
| Order | orders | SalesOrderDetailID_K |
| Employee | employees | EmployeeID_K |
| Product | products | ProductID_K |
| ProductCategory | productcategories | CategoryID_K |
| ProductSubcategory | productsubcategories | SubcategoryID_K |
| Vendor | vendors | VendorID_K |
To add the nodes to your graph, follow these steps:
In your graph model, select Add node to add a new node to your graph.
In the Add node to graph dialog, enter a Label name and select the appropriate Mapping table and Mapping column.

In this example, the node label is "Customer", the mapping table is "customers", and the mapping column is "CustomerID_K".
Select Confirm to add the node to your graph.
Repeat the process for all other nodes. You should see all the nodes represented in your graph.
Select Save to start generating your graph.


Add edges
In this section, we create edges to define the relationships between the nodes in the Adventure Works data model.
| Edge | Mapping table | Source node mapping column | Target node mapping column |
|---|---|---|---|
| sells | orders | Employee EmployeeID_FK |
Order SalesOrderDetailID_K |
| purchases | orders | Customer CustomerID_FK |
Order SalesOrderDetailID_K |
| contains | orders | Order SalesOrderDetailID_K |
Product ProductID_FK |
| isOfType | products | Product ProductID_K |
ProductSubCategory SubcategoryID_FK |
| belongsTo | productsubcategories | ProductSubCategory SubcategoryID_K |
ProductCategory CategoryID_FK |
| produces | vendorproduct | Vendor VendorID_FK |
Product ProductID_FK |
To add the edges to your graph, follow these steps:
Select Add edge to create a relationship between nodes.
In the Add edge dialog, select the mapping table, source and target nodes, and define the relationship.

In this example, the edge is defined as "sells" with the mapping table "orders", connecting the source node "Employee" (EmployeeID_FK) to the target node "Order" (SalesOrderDetailID_K).
Select Confirm to add the edge to your graph.
Repeat the process for all other edges. You should see all the edges represented in your graph.


By this point, you created all the nodes and edges for your graph. These nodes and edges are the basic structure of your graph model.
Load the graph
To load the graph, select Save. Selecting Save verifies the graph model, load data from OneLake, construct the graph, and ready it for querying.
Important
You currently need to reload the graph (by selecting Save) whenever the model or the underlying data is changed.
Query the graph
Graph in Microsoft Fabric uses the same workspace roles as other Microsoft Fabric items. The following workspace role permissions apply depending on whether you run queries via the Graph Model or QuerySet item.
Workspace role permissions for Graph Model
| Capability | Admin | Member | Contributor | Viewer |
|---|---|---|---|---|
| Create or modify graph model | ✔ | ✔ | ✔ | ✖ |
| Delete graph model | ✔ | ✔ | ✔ | ✖ |
| View and read content of graph model | ✔ | ✔ | ✔ | ✔ |
| Share graph model | ✔ | ✔ | ✖ | ✖ |
| Create or modify graph queries | ✔ | ✔ | ✔ | ✖ |
| Create or modify graph QuerySet item | ✔ | ✔ | ✔ | ✖ |
Workspace role permissions for Graph QuerySet
| Capability | Admin | Member | Contributor | Viewer |
|---|---|---|---|---|
| Create or modify graph QuerySet item | ✔ | ✔ | ✔ | ✖ |
| Delete QuerySet item | ✔ | ✔ | ✔ | ✖ |
| View and read content of QuerySet item | ✔ | ✔ | ✔ | ✔ |
| Connect to graph instance | ✔ | ✔ | ✔ | ✖ |
| Share QuerySet | ✔ | ✔ | ✖ | ✖ |
Note
All users need read access to the underlying graph instance item to execute queries against the referenced graph instance from the graph QuerySet item. Only read, write, and reshare permissions are supported for QuerySet item.
Using the query builder
Now, we can query the graph by selecting specific nodes and relationships. All queries are based on the graph structure that we built in the previous section..
Follow these steps to switch to query builder and start querying your graph interactively:
Select Modes > Query builder from your graph's home page. From this view, you can also create a read-only queryset, which has the same functionalities as below and allows you to share your query results.
Select Add node to see the available nodes for querying.
Select a node to add it to your query. In this example, we add the Customer node.

From here you can build your query by adding nodes and edges, applying filters, and selecting properties to return in the results.

Using the code editor
We can also query the graph using the Graphics Query language (GQL).
Follow these steps to switch to code editor and start querying your graph using GQL:
- Select Modes > Code editor from your graph's home page.
- Enter a GQL query into the input field, such as
MATCH (n:`Order`) RETURN count(n) AS num_orders. - Select Run query to execute the query.
You can also run more complex queries, such as queries that combine matching graph patterns, filtering, aggregation, sorting, and top-k limiting:
MATCH (v:Vendor)-[:produces]->(p:`Product`)->(sc:`ProductSubcategory`)->(c:`ProductCategory`),
      (o:`Order`)-[:`contains`]->(p)
FILTER c.categoryName = 'Components'
LET vendorName = v.vendorName, subCategoryName = sc.subCategoryName
RETURN vendorName, subCategoryName, count(p) AS num_products, count(o) AS num_orders
GROUP BY vendorName, subCategoryName
ORDER BY num_orders DESC
LIMIT 5
For further information about GQL language support, consult the GQL language guide.