Note
Access to this page requires authorization. You can try signing in or changing directories.
Access to this page requires authorization. You can try changing directories.
The preview experience in ontology (preview) allows you to view and explore your instantiated ontology data. The experience includes basic data previews, instance data, and a graph view.
Important
This feature is in preview.

Prerequisites
Before using the preview experience, make sure you have the following prerequisites:
- A Fabric workspace with a Microsoft Fabric-enabled capacity.
- Ontology item (preview) and Graph (preview) enabled on your tenant.
- An ontology (preview) item with data binding completed.
Key concepts
The preview experience uses the following ontology (preview) concepts.
- Entity type: An abstract representation of a business object (like Vehicle or Sensor). It defines a logical model of an item.
- Entity instance: A specific occurrence of an entity type, representing a real-world object with its own unique values for the defined properties. For example, if Vehicle is an entity type, then a particular car with its own VIN, make, and model is an entity instance.
- Graph in Microsoft Fabric: A Fabric item that offers native graph storage and compute for nodes, edges, and traversals over connected data. It's good for path finding, dependency analysis, and graph algorithms. Graph in Microsoft Fabric is integrated into ontology's preview experience.
How-to steps
This section contains step-by-step instructions for major actions within the preview experience.
Access preview experience
Follow these steps to access the preview experience and see the entity type overview.
In the Entity Types pane, select the entity type that you want to view. Select Entity type overview.

The preview experience opens.

In the preview experience, you see an overview for the entity type that lets you preview the data of all the entity instances. There are multiple ways to explore the data in this view:
View and create tiles: You can view data in line charts and create more tiles as needed. You can also configure time-specific slices for the tiles.
Use graph view: You can view your entity instances in a graph view provided through Graph in Microsoft Fabric. You can also open your entity directly in Graph in Microsoft Fabric, where you can see more options for drilling down into your data and learning about your instantiated ontology.
Explore entity instances: You can browse to a specific entity instance to get more information about it in the instance view.
View and create tiles
Tiles are automatically visible in the preview experience and display data about your entity types, including entity instance details and relationship graphs.
To create more tiles, follow these steps.
From the ribbon, select + Add Tile.

Select the type of tile you want to create: a Timeseries chart for streaming data, or Fabric Graph for a relationship graph. Only one graph tile is allowed per dashboard.
In the tile configuration options, configure the fields for the X and Y axis, and the property you want to display.

Note
All tiles created at the entity level propagate down to the entity instance level.
Back on the overview page, use the time range selector to configure the time range for the data displayed in the tiles.


You can also edit or delete existing tiles by selecting ... in the top right corner of a tile.

Use graph view
Follow these steps to view your entities in a graph view using Graph in Microsoft Fabric.
Select Expand from a graph tile in the preview experience.

The full graph view opens:


In the graph view, you can explore using Graph in Microsoft Fabric's interface, and craft custom queries as described in the next section.
Query entity instances
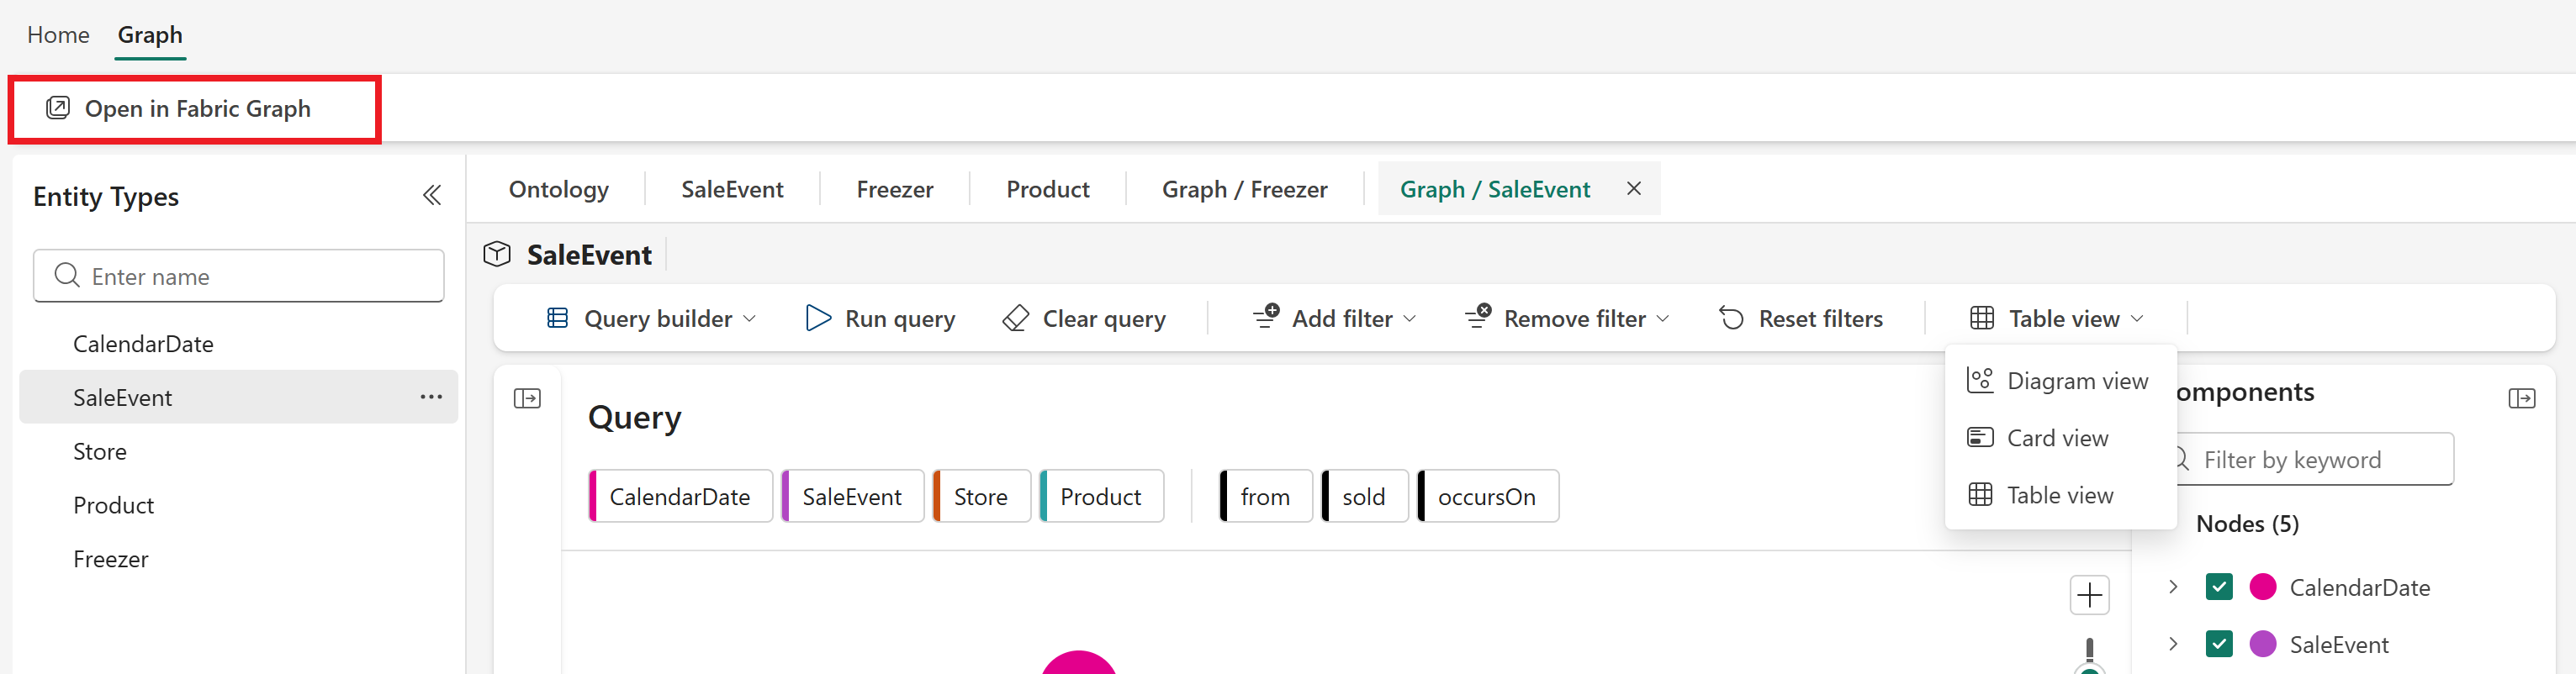
In the full graph view, use the Query builder ribbon to craft custom queries.

The default query shows the current entities and all relationships that are one hop away. Selecting Run query runs the default query, and you see the results in a pane underneath the relationship type graph.

To change the query, you can Add filters for property values, or change the Components that are visible in the graph.

You can also change the view type of the query results, from Diagram to Card or Table.

To run more complex queries or explore the data in more detail, navigate to the Graph in Microsoft Fabric interface by selecting Open in Fabric Graph. For more information, see Graph in Microsoft Fabric overview (preview).
Explore entity instances
You can browse to a specific entity instance to see more information about that specific instance.
To open the instance view, start in the overview page for the entity type, and select a row from the Entity instances table.

The instance view displays any tiles configured at the entity type level, and any specific properties bound to this instance.

You can also Expand the graph view, where you can run a query specific to this entity instance, with one hop of depth.

Refresh your downstream experiences in ontology (preview)
This section describes how and when your bound data stays up to date.
In ontology (preview), downstream experiences automatically refresh whenever you make changes to your ontology schema. This means that whenever you add, edit, or remove any element like properties, types, or relationships, the system will re-ingest all currently bound data to ensure your downstream experiences reflect the latest schema adjustments.
However, this automatic refresh only applies to changes made within the schema itself. If there are changes to the external data source that feeds your graph (for example, if new records are added, updated, or deleted in the upstream system), the graph doesn't know about these changes unless it is explicitly informed. In this case, your graph might display stale data until a new ingestion is triggered. You can enforce an update by manually refreshing the graph.
Important
We recommend batching updates for refresh instead of refreshing the graph after every individual change, as the graph does a full refresh each time. This has cost implications for the Graph in Microsoft Fabric item.
To refresh the graph, follow these steps:
Go to your Fabric workspace, and locate the graph model associated with your ontology (preview) item.

Select ... to expand the option menu for the graph model, and select Schedule.

In the Schedule view, select Refresh now.
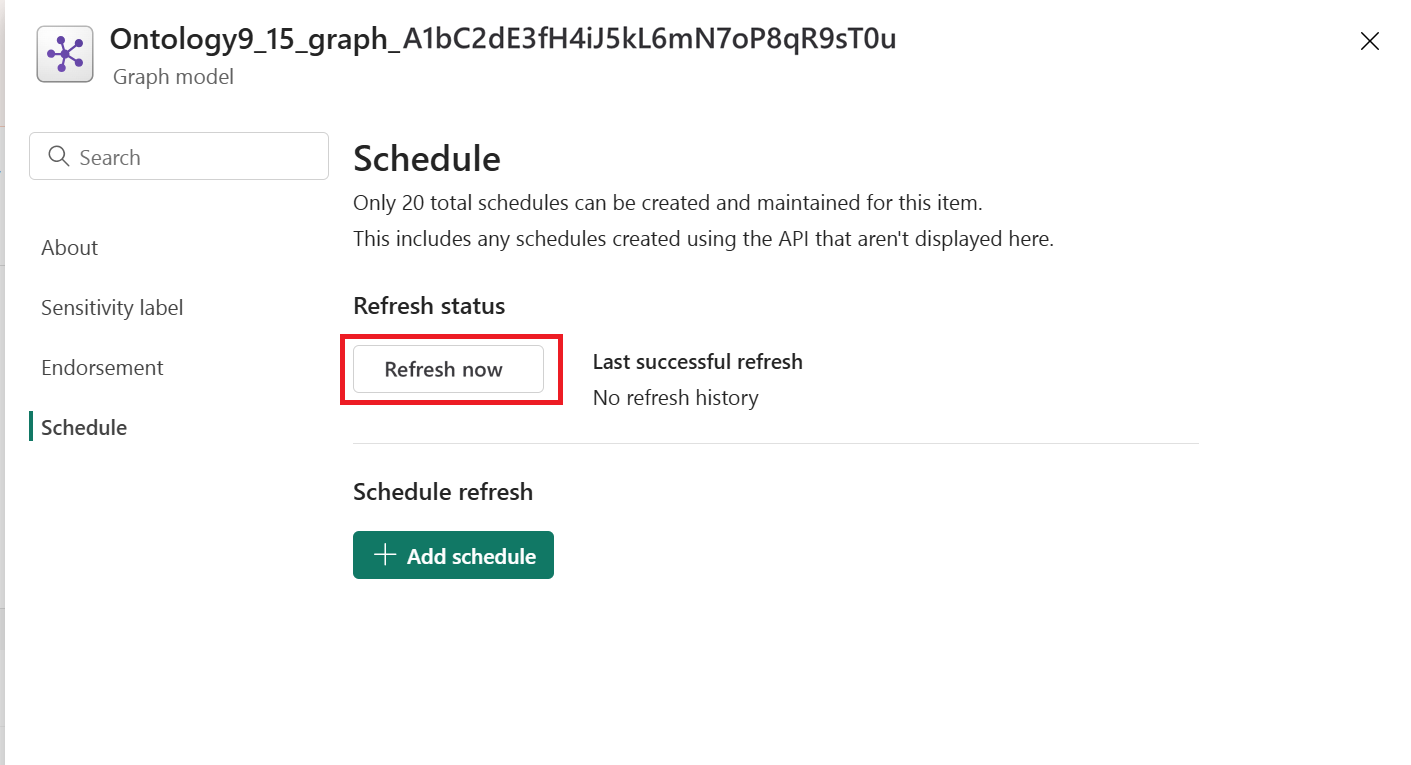
When you return to the ontology item, the data shown reflects your changes.
Troubleshooting
Here are troubleshooting tips for using the preview experience:
- To access the preview experience for an ontology, you must have access to the lakehouse that contains the source data for the ontology's data bindings. If you open the preview experience without access to the lakehouse, you see a
403 ForbiddenHTTP response. To resolve this issue, contact your administrator to obtain access to the lakehouse.