Note
Access to this page requires authorization. You can try signing in or changing directories.
Access to this page requires authorization. You can try changing directories.
In this tutorial step, explore your ontology with the preview experience. Inspect entity instances that instantiate your entity types with data, and explore graph-shaped context across sales and device streaming data.
Important
This feature is in preview.
Preview entity instances
When you bound data to your entity types in previous tutorial steps, ontology automatically created instances of those entities that are tied to the source data rows. In this section, you use the preview experience to view those entity instances.
Select the SaleEvent entity type, and select Entity type overview from the top ribbon.

It might take a few minutes for the ontology overview to load the first time.
Look for the Entity instances section. Verify that it shows entity instances, with unit counts and revenue populated from the factsales lakehouse table.

Tip
If data bindings don't load, confirm that the source data tables exist with matching column names, and that your Fabric identity has data access.
Open the Freezer entity type in the preview experience, by selecting it in the Entity Types pane and selecting Entity type overview from the top ribbon.
Update the time range from the default of Last 30 minutes to a custom date range that begins on Fri Aug 01 2025 at 12:00 AM, ends on Mon Aug 04 2025 at 12:00 AM, and has a Time granularity of 1 minute.

Observe the time series data that's visible from different Freezer entity instances.


Preview ontology graph
The preview experience also contains a Relationship graph, which you use to visualize your ontology in a graph of nodes and edges.
Use the tabs across the top of the preview experience to reopen the SaleEvent entity type. In the Relationship graph tile, select Expand.

In the graph, observe the details of the relationships to the SaleEvent entity type from Store and Products.

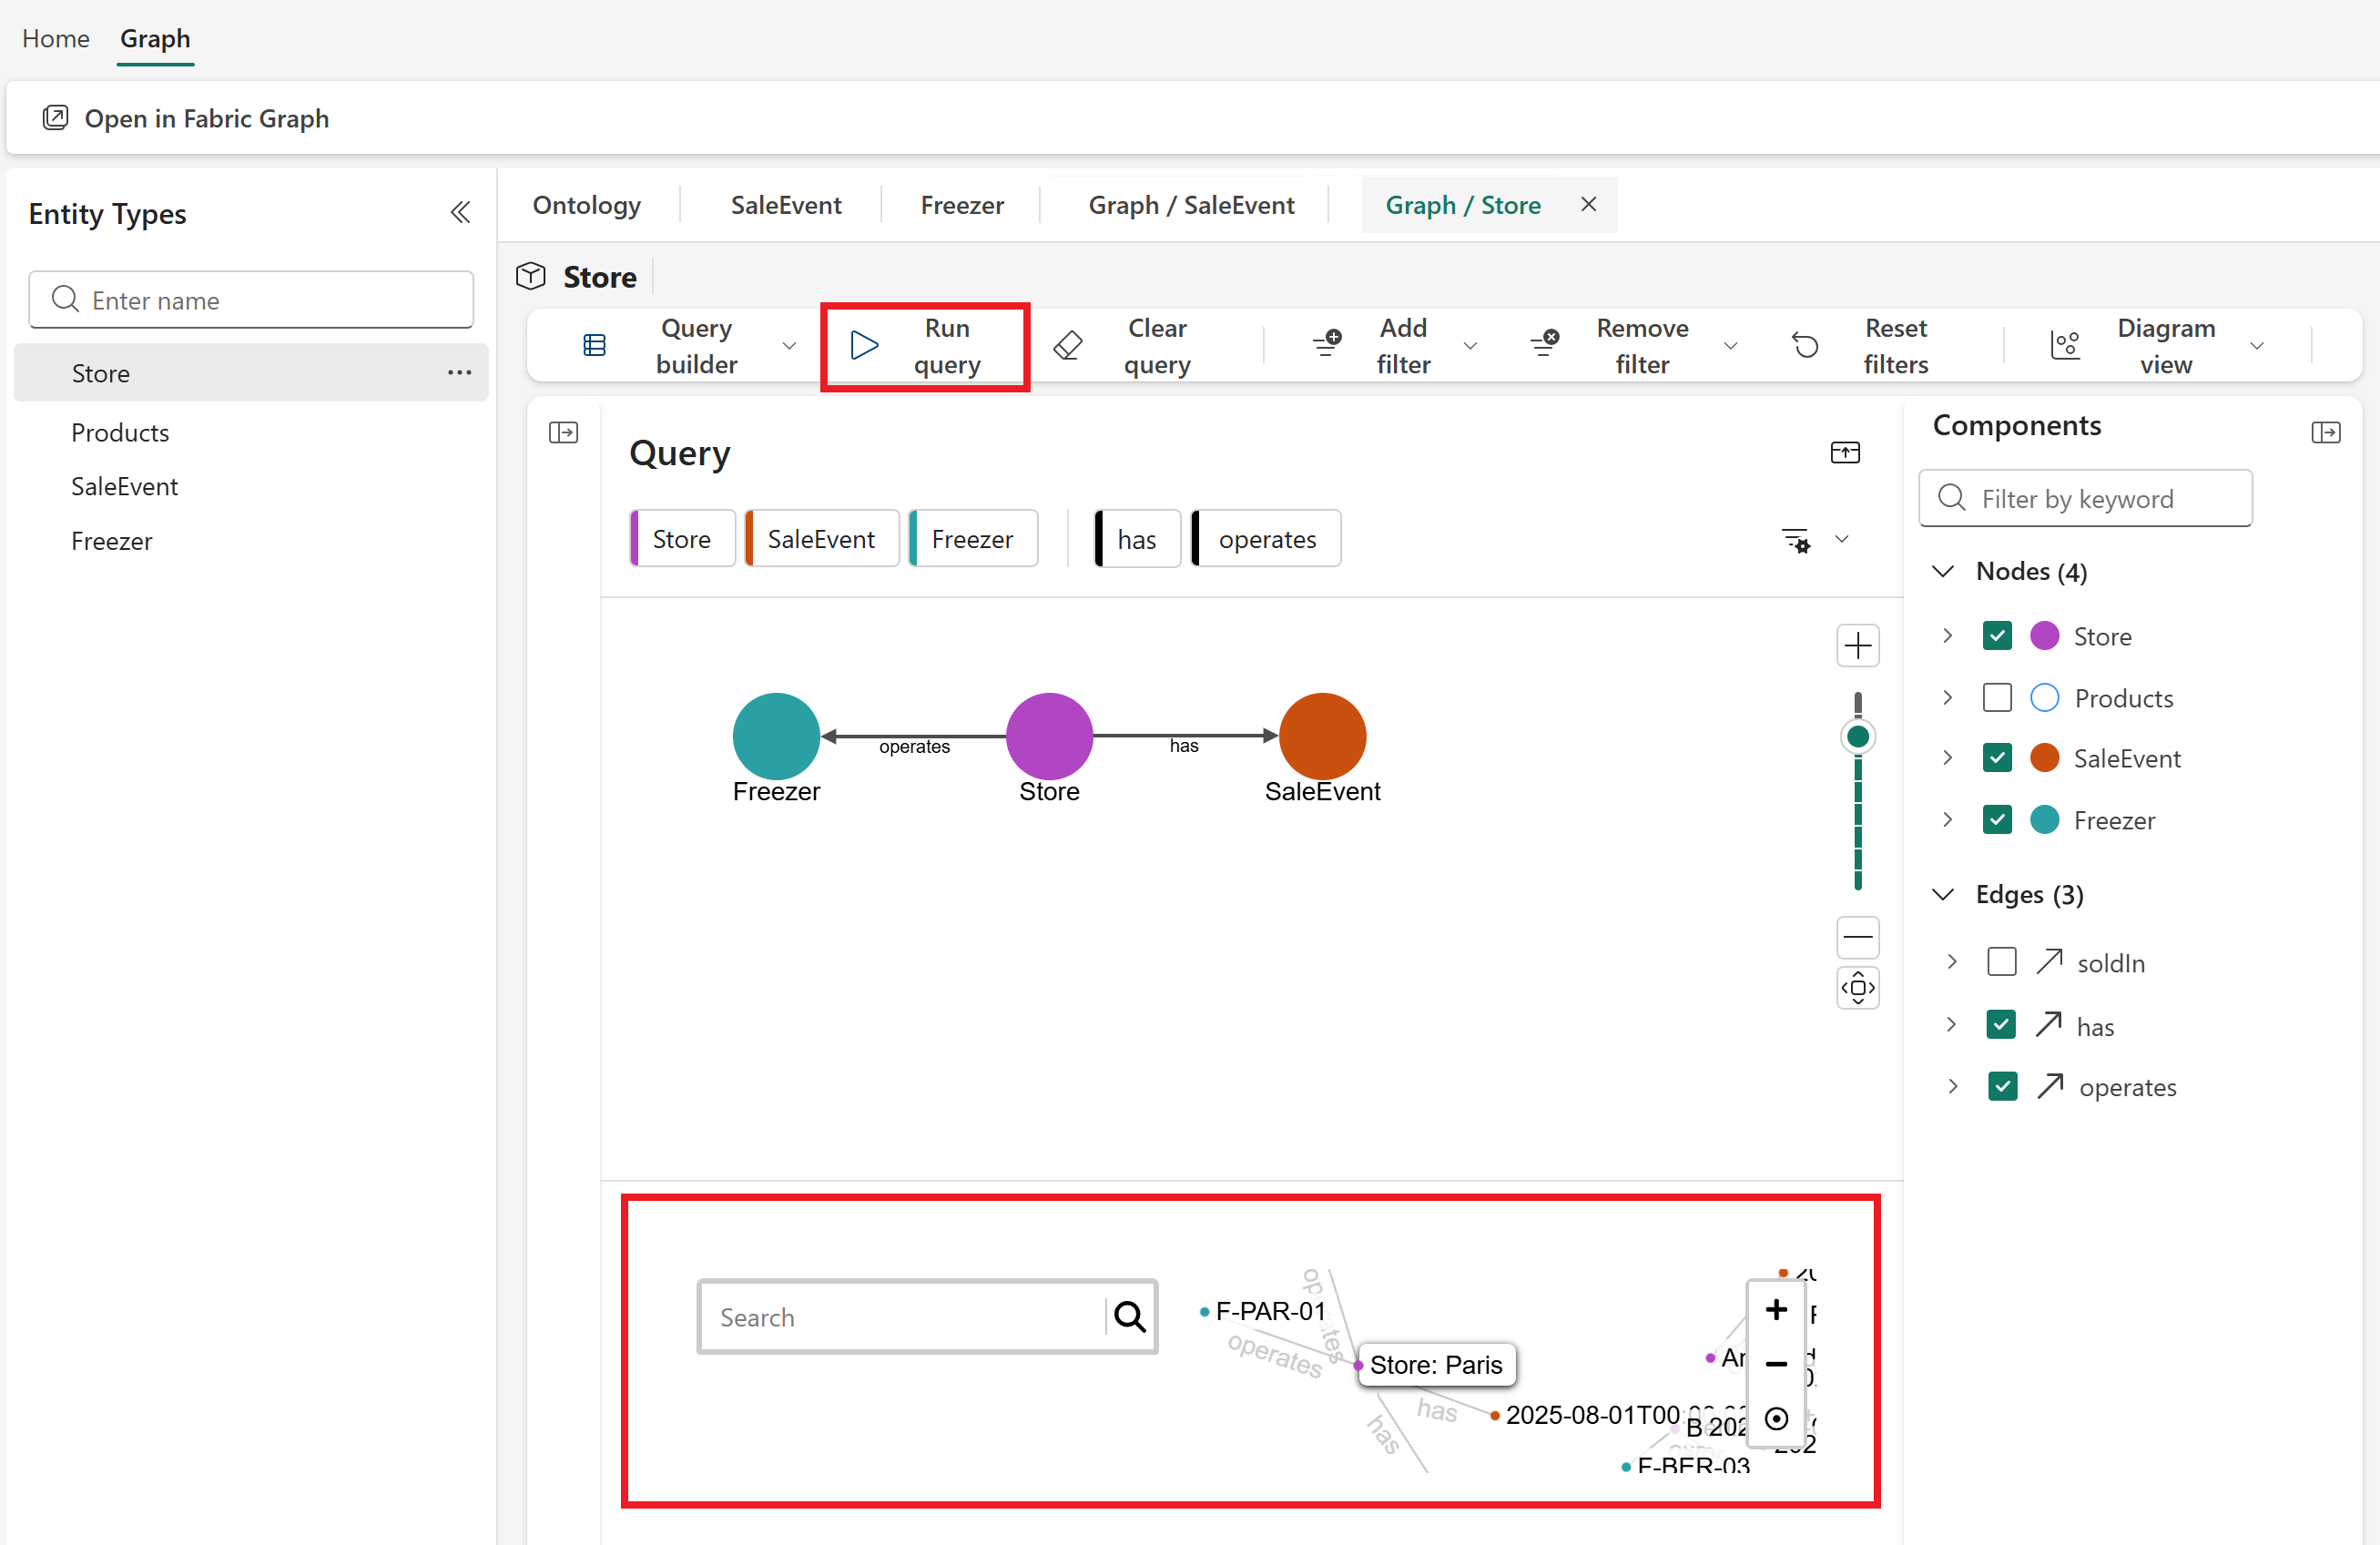
Open the preview experience for the Store entity type, and Expand its relationship graph.
In the graph, observe the relationship between Store and SaleEvent, and the relationship between Store and Freezer. Then, select Run query in the query builder ribbon to run the default query and see a graph of entity instances and their connections.


Tip
If the graph looks sparse, check the entity type keys in the data bindings and verify that they match the keys defined in Create entity types and data bindings. For example, the key for the SaleEvent entity type is SaleId.
Query graph instances
In the relationship graph view, you can query your ontology for entity instances that meet certain criteria. Use the Query builder filters in the top ribbon to craft queries.

First, craft this query: Show all freezers that are operated in the Paris store.
In the Store entity's relationship graph, select Add filter > Store > StoreId from the query builder ribbon. Set the filter for
StoreId = S-PAR-01. This value is the store ID for the Paris store.
In the Components pane, uncheck SaleEvent so that the only checked fields are Nodes > Store, Nodes > Freezer, and Edges > operates.

Select Run query and verify that the instance graph shows two freezers connected to the Paris store.

Select Clear query to clear the query results, and use the Remove filter options to remove the store filter.


Next, craft this query: Show all stores that have made a sale with a revenue greater than 150.
Select Add a node and add a node for SaleEvent.

In the Components pane, check the boxes next to Nodes > Store and Edges > has to add them to the graph.
From the query builder ribbon, select Add filter > SaleEvent > RevenueUSD. Set the filter for
RevenueUSD > 150.
Select Run query and verify that the instance graph shows two stores that meet the filter for their connected sale events. You can also select the nodes in the graph to get details of the specific sale events


This process allows you to inspect the paths that connect operational issues (like rising freezer temperature at certain stores) to business outcomes (sales).
Next steps
In this step, you previewed the instances connected to your ontology and explored the data they contain. Next, create a data agent to explore the data further with natural language queries.
Continue to Create data agent.