Note
Access to this page requires authorization. You can try signing in or changing directories.
Access to this page requires authorization. You can try changing directories.
Collecting diagnostic information from Power BI service helps Microsoft Support troubleshoot your issues faster. Browser traces are diagnostic files that capture detailed information about what happens in Power BI when problems occur.
This article shows you how to capture browser traces, HAR files, and console logs. Power BI admins can attach these diagnostic files to support requests through the Power Platform admin center. For Power BI Desktop diagnostics, see Power BI Desktop diagnostics collection.
Collect a browser trace
Important
Sign in to the Power BI service before you start to collect browser trace information, no matter which browser you use. This step is important to make sure that the trace information doesn't include sensitive information related to your sign-in.
Google Chrome and Microsoft Edge (Chromium) both use the Chromium open source project. The following steps show how to use the developer tools, which are similar in the two browsers. For more information, see Chrome DevTools and Microsoft Edge (Chromium) Developer Tools. The following reference images come from Google Chrome.
After signing in, press F12 on your keyboard. Or, in Microsoft Edge select Settings and more (...) > More tools > Developer tools. In Google Chrome, select Customize and control Google Chrome
 > More tools > Developer tools.
Prepare to collect the browser trace by setting trace options. You also stop and clear any information that was collected before you start to reproduce the problem. By default, the browser keeps trace information only for the page that's currently loaded. Follow these steps to set up the browser to keep all trace information, even if your repro goes to more than one page:
In the Developer tools window, select the Network tab. Then, select Preserve log.

Select the Console tab, then select Settings > Preserve log.
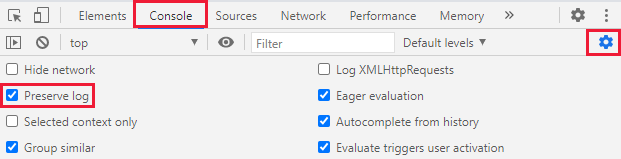
Select Settings again to close the Console settings.
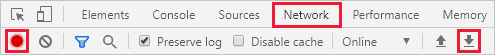
Next, stop and clear any recording in progress. Select the Network tab, select Stop recording network log, then Clear.

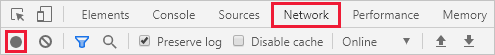
Now, you reproduce the problem that you were having in the Power BI service. To start, in Developer tools select the Network tab. Select Record network log.
Important
Refresh the browser page in the Power BI service before you start to reproduce the problem so that traces are correctly captured.
Reproduce the steps that resulted in the problem you need help with.
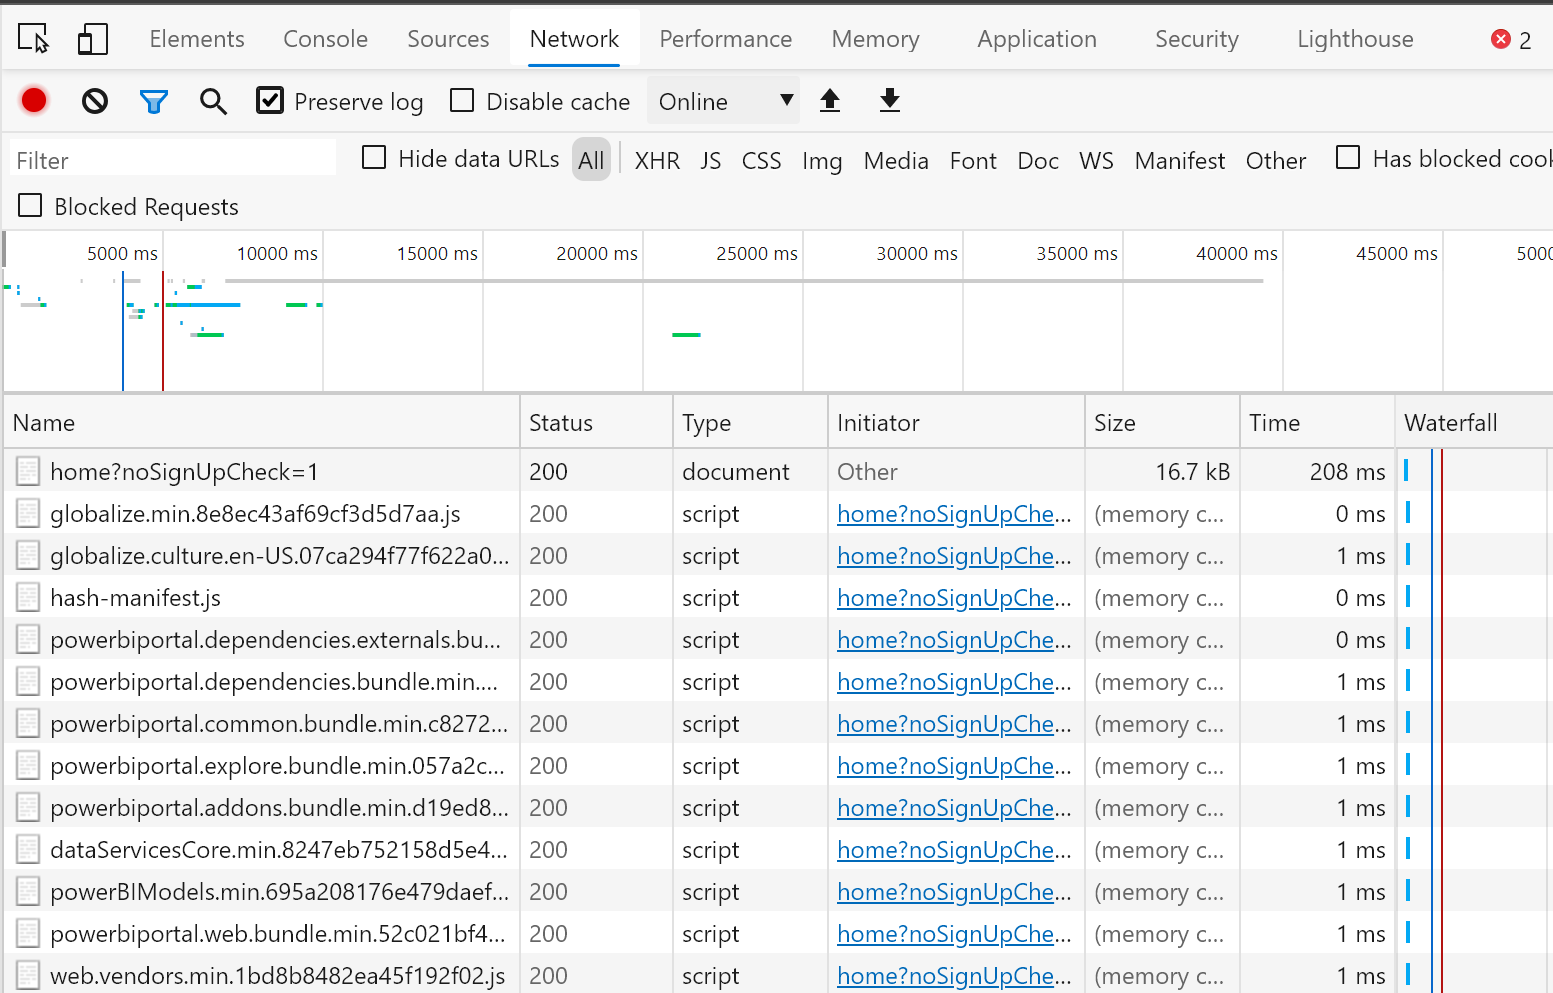
As you reproduce the problem, you see output similar to the following image in the Developer tools window.
After reproducing the problem behavior, save the log files and attach them to your support request.
To export the network log, in Developer tools select the Network tab. Select Stop recording network log. Then, select Export HAR... and save the file.
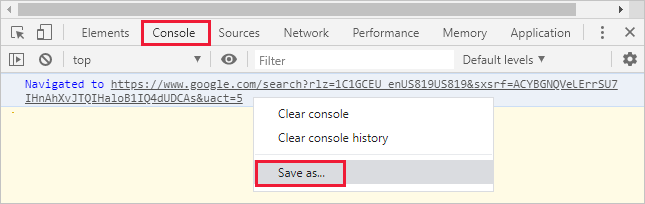
To export the console output, in Developer tools select the Console tab. Right-click on a displayed message, then select Save as..., and save the console output to a text file.
Package the saved HAR file, console output, and screen recording in a compressed format, such as .zip, and attach the file to your support request.


 > Web Developer > Toggle Tools. The tools appear at the bottom of your screen.


After you collect the diagnostic files, attach them to your support request to help the support engineer solve your problem. The HAR file contains all the information about network requests between the browser window and the Power BI service, including:
- The activity IDs for each request.
- The precise timestamp for each request.
- Any error information returned to the client.
This trace also contains the data used to populate the visuals shown on the screen.